The schools in Newark and nearby communities are among the most severely segregated in the nation, according to a new nationwide analysis.
The Newark area ranks first in economic segregation and second in Black-white segregation, according to the analysis of public and private schools in all 403 metropolitan areas in the United States. The rate of segregation between Black and white students in Newark’s region is nearly three times the national average.
The Newark metropolitan area includes 118 school districts spread across six counties in northern New Jersey and one county in Pennsylvania. The vast majority of racial and economic segregation in that area occurs between school districts, not within them, according to the analysis, which also found that school segregation is more extreme in the Northeast than in other regions of the country.
The new report was published Tuesday, exactly 68 years after the U.S. Supreme Court ruled in Brown v. Board of Education that segregated schools are inherently unequal. On the same day four years ago, a coalition of families and advocacy groups filed a lawsuit claiming that New Jersey’s widespread school segregation violates the state constitution and harms students.
“Almost seven decades after Brown v. Board, we still see intense levels of segregation across the country,” said Halley Potter, author of the report and a senior fellow at The Century Foundation, a liberal think tank.
The Newark area “stands out as one of the most segregated metro areas,” Potter added, though the legal challenge, which a state Superior Court judge is expected to rule on in the coming weeks, has the potential to change that. “It also stands out to me as one of the places where I do see some hope.”
Potter partnered with the Segregation Index, a project led by researchers Ann Owens and Sean Reardon. Their analysis, including an interactive map, is based on data from the 2017-18 school year across all metropolitan areas, which are home to about 85% of the U.S. population.
The analysis uses a 0-1 index to measure segregation, where 0 indicates that students in different racial or economic groups are evenly spread across schools and 1 means the groups are fully separated. In this model, a value above 0.5 is considered “very severe” segregation.
Among all metro areas in the U.S., the average level of Black-white student segregation is 0.24, the analysis found. But in the Newark metro area, the segregation level is a staggering 0.71 — second only to the Milwaukee area, whose level is 0.73.
The segregation level shows the average demographic gap, measured in percentage points, between schools in a given area. The way the analysis explains it: If the average Black student in the Newark region attends a school where only 10% of students are white, then the average white student goes to a school that is 81% white — a 71-point gap.
While the analysis combines seven counties in the Newark area, vast racial disparities also can be found within individual counties. For example, in Essex County where Newark is located, 75% of students in the Glen Ridge school district are white. Just three miles away in the East Orange district, only 1% of students are white.
“One of the top-line findings continues to be that Black-white segregation is the most extreme form of racial segregation in our schools,” Potter said.
Schools are also divided by family income. Across all metro areas, the average economic segregation level is 0.19, according to the analysis, which used students’ eligibility for free or reduced-priced lunch as a proxy for low family income.
But the Newark area’s rate, 0.49, is more than double the national average and higher than in any other metro area. In other words, the analysis says, if the average poor student in the Newark metro area attends a school where 75% of students are also poor, the average non-poor student goes to a school where only 26% of students are poor.
The analysis also sought to pinpoint the sources of this segregation. It looked at how students are sorted between public and private schools, within and across school districts, and between different types of public schools, such as traditional and charter schools.
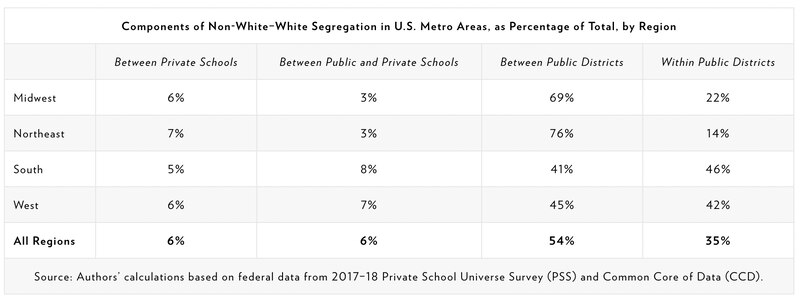
It found that, nationwide, private schools and charter schools account for a small portion of racial school segregation — just 12% and 4%, respectively. By contrast, 35% of the segregation between white and non-white students happens among traditional public schools in the same districts.
But the bulk of racial segregation — 54% — is caused by the differences between districts, not within them. In other words, white students and students of color are more likely to be enrolled in separate districts than to attend different schools in the same district.

Many districts are “wildly different from each other,” Potter said, “even though the schools within each district might not have that many demographic differences.”
The story is somewhat different for economic segregation. The analysis found that nationwide, 57% of the sorting of poor and non-poor students happens within school districts, while 43% occurs between districts.
However, that is not the case in the Northeast, where 73% of economic school segregation and 76% of racial segregation happens across district lines. The reason: States like New Jersey are home to hundreds of small school districts that map onto segregated communities, all but ensuring that schools will reflect the localities’ divided demographics. By contrast, Southern states, many of which faced federal desegregation orders in the past, tend to have countywide school districts that each encompass a range of communities.
The Newark area offers an extreme example of how fragmented districts can drive segregation. A whopping 96% of economic segregation and 88% of racial segregation occurs between the area’s small, demographically divided districts, according to the analysis. Only a fraction of the segregation happens within those districts.
Segregation between districts presents a special challenge.
“That’s not a problem that school district leaders — superintendents or school boards — can solve on their own,” said Potter, noting that those officials control the enrollment policies and attendance boundaries only inside their own districts. “It really requires having some state or federal involvement.”
In the decades since the Brown decision, conservative majorities on the Supreme Court have struck down or curtailed school desegregation plans. Meanwhile, many federal desegregation orders have been lifted or gone unenforced.
But advocates in New Jersey believe they can circumvent those legal obstacles by turning to the state’s own constitution, which explicitly bans school segregation. In their lawsuit, they propose possible remedies, such as creating magnet schools that enroll students from multiple districts, allowing students to attend schools in different districts, or consolidating districts.
On Tuesday, three racial justice groups in New Jersey released a statement lamenting the persistence of school segregation in the state so long after the 1954 Brown decision. The groups — Salvation and Social Justice; the Inclusion Project; and the Latino Action Network, which is a plaintiff in the lawsuit — said they hope New Jersey’s high court will force the state to live up to its ideals.
“Now, thanks to a lawsuit filed four years ago today,” they wrote, “New Jersey students have a path toward a fairer, more diverse education.”
Patrick Wall is a senior reporter for Chalkbeat Newark, covering public education in the city and across New Jersey. Contact Patrick at pwall@chalkbeat.org.


