
An unreleased report by a school choice group backed by the business community paints in stark detail what many Chicagoans have known for years: that top academic schools are clustered in wealthier neighborhoods, and that fewer black and Latino students have access to those schools.
The report highlights startling figures: About 27 percent of black students are in the district’s lowest-rated schools, compared with 8 percent of Latino students and 3 percent of whites. It also says that while Chicago Public Schools has more than 150,000 unfilled seats, 40 percent, or 60,000 of them, are at top-ranked schools. That surplus will grow as enrollment, which has been plummeting for years, is projected to decline further by 5.1 percent over the next three years to about 350,000. What that means is the cash-strapped district is moving toward having nearly one extra seat for every two of its students.
The document effectively shows that, in many areas of the city, students are skipping out on nearby options, with less than half of district students attending their designated neighborhood schools.
In a city still reeling from the largest mass school closure in U.S. history, this report could lay groundwork for another round of difficult decisions.
The “Annual Regional Analysis” report, compiled by the group Kids First Chicago on CPS’ behalf, has been circulating among select community groups but has not been made public. It comes on the heels of a report showing students’ high school preferences vary with family income level. Students from low-income neighborhoods submit more applications than students from wealthier ones and apply in greater numbers for the district’s charter high schools.
The group behind the latest report has had many iterations: Kids First is a new name, but its origins date back to 2004, when it started as the charter fundraising group Renaissance Schools Fund. That was during the Renaissance 2010 effort, which seeded 100 new schools across the city, including many charters. The group changed its name to New Schools Chicago in 2011 and again rebranded this year as Kids First, with a greater focus on parent engagement and policy advocacy.
The report has caused a stir among some community groups who’ve seen it. Because the school district has used enrollment figures to justify closing schools, some people are worried it could be used to propose more closings, turnarounds, and charter schools.
“To me this is the new reason [for school closings],” said Carolina Gaeta, co-director of community group Blocks Together, which supports neighborhood schools. “Before it was academics, then it was utilization, now it’s going to be access and equity. Numbers can be used any way.”
In a statement on the report, Chicago Teachers Union Spokeswoman Christine Geovanis blasted Mayor Rahm Emanuel’s administration for policies that she alleged “undermine enrollment at neighborhood schools,” such as the proliferation of charter schools, school budget cuts, and building new schools over the objection of community members.
Reached by phone Thursday, Kids First CEO Daniel Anello confirmed that his organization helped put the report together, but declined to comment on its contents, deferring to the district. CPS Spokeswoman Emily Bolton acknowledged the report’s existence in a statement emailed to Chalkbeat Chicago that said the school district “is having conversations with communities to get input and inform decisions” about where to place particular academic programs. The statement said CPS is still in the process of drafting a final version of the document, but gave no timetable. Mayor Rahm Emanuel’s office didn’t grant requests for interviews about the Annual Regional Analysis.
Below is a preview of the report provided to Chalkbeat Chicago.
Gaps in access to arts and IB programs
Data released this week from the district’s GoCPS universal high school application clearly shows what academic programs are most in demand: selective enrollment programs that require children to test in; arts programs; and career and technical education offerings, or CTE.
The Kids First’s analysis puts those findings into context, however, by detailing how supply is geographically uneven, especially when it comes to arts. Maps in the report divide the city into regions defined by the city’s planning department and show how highly-desirable arts programs are not spread equally throughout the city, and are most concentrated along the northern lakefront and downtown.
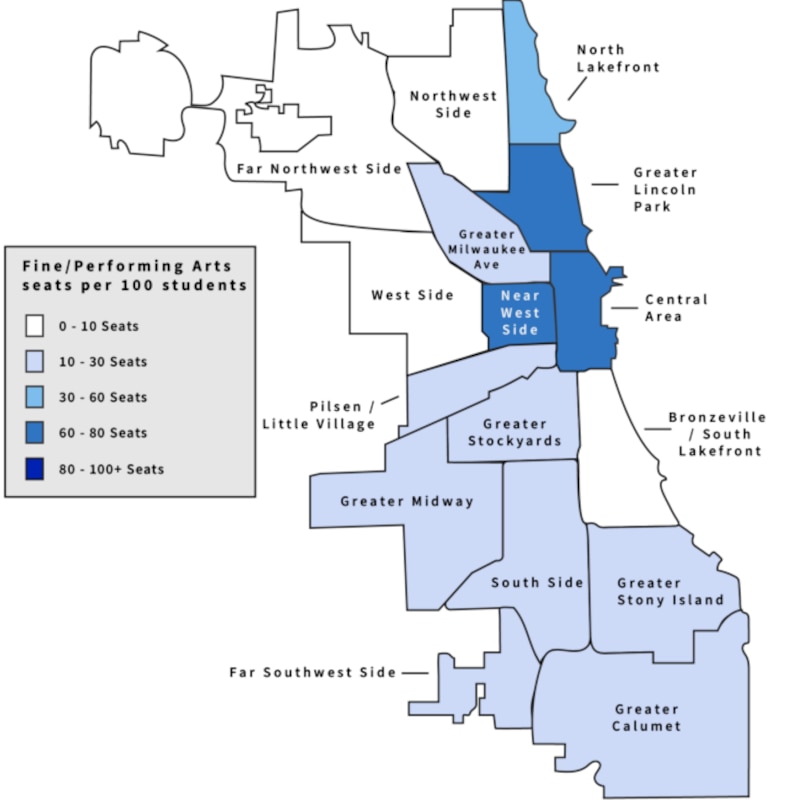
Worse, four regions offer 10 or fewer arts seats per 100 students, including the Bronzeville/South Lakefront region that includes neighborhoods such as Woodlawn, Kenwood, Hyde Park, Washington Park and Bronzeville. They are also scarce in the West Side region, which includes Austin, Humboldt Park and North Lawndale, in the Far Northwest neighborhoods of Belmont Cragin, Dunning, and Portage Park, and in the Northwest Side area, home to neighborhoods like West Ridge and Albany Park.
The report also shows an imbalance in the number of rigorous International Baccalaureate programs.
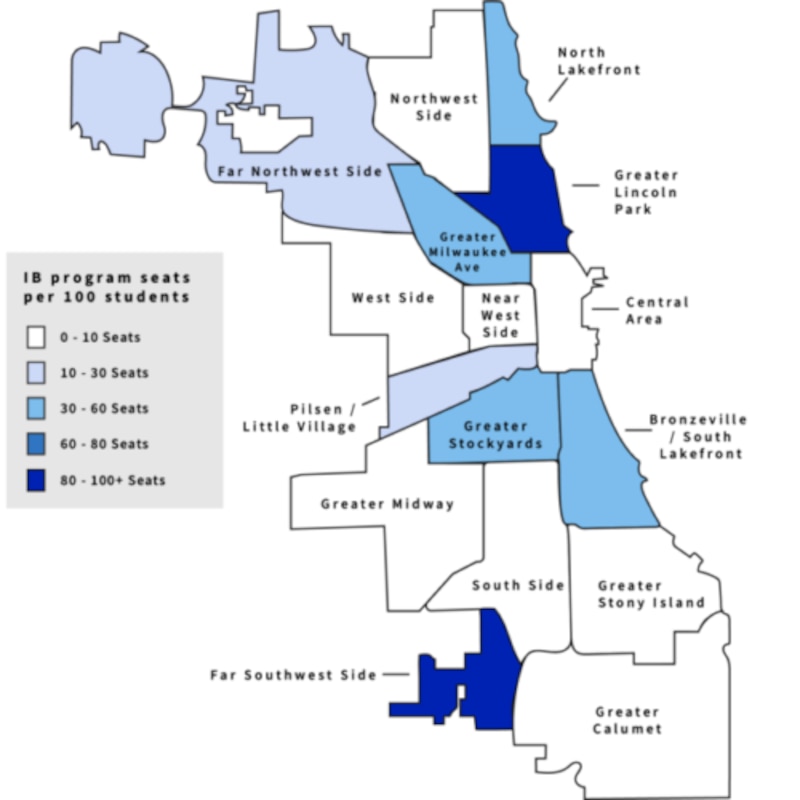
The highest number of IB seats are in the wealthy, predominately white and affluent Greater Lincoln Park area, which includes the Near North Side, Lakeview, and Lincoln Park. In contrast, there are far fewer IB seats in predominantly black communities such as Englewood and Auburn Gresham, in the predominantly Latino Back of the Yards, and in the mostly black and Latino community of Ashburn. All of those communities are in the South Side planning region.
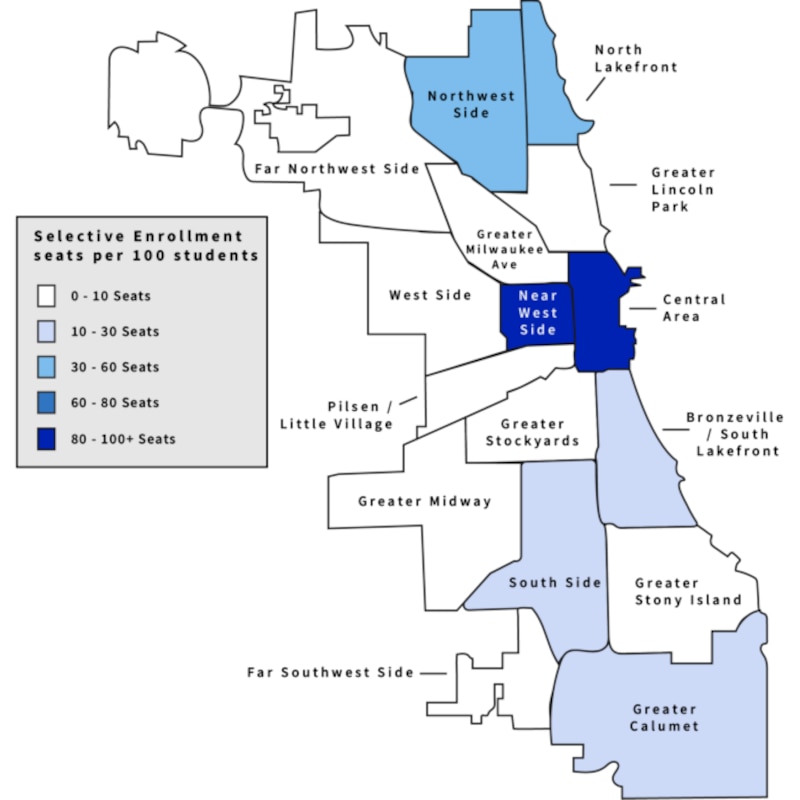
When it comes to selective-enrollment elementary school programs such as gifted centers and classical schools, which require students to pass entrance exams, options tend to be concentrated, too, with fewer choices on the South and West sides of the city. This map shows where selective enrollment high school options are most prevalent:
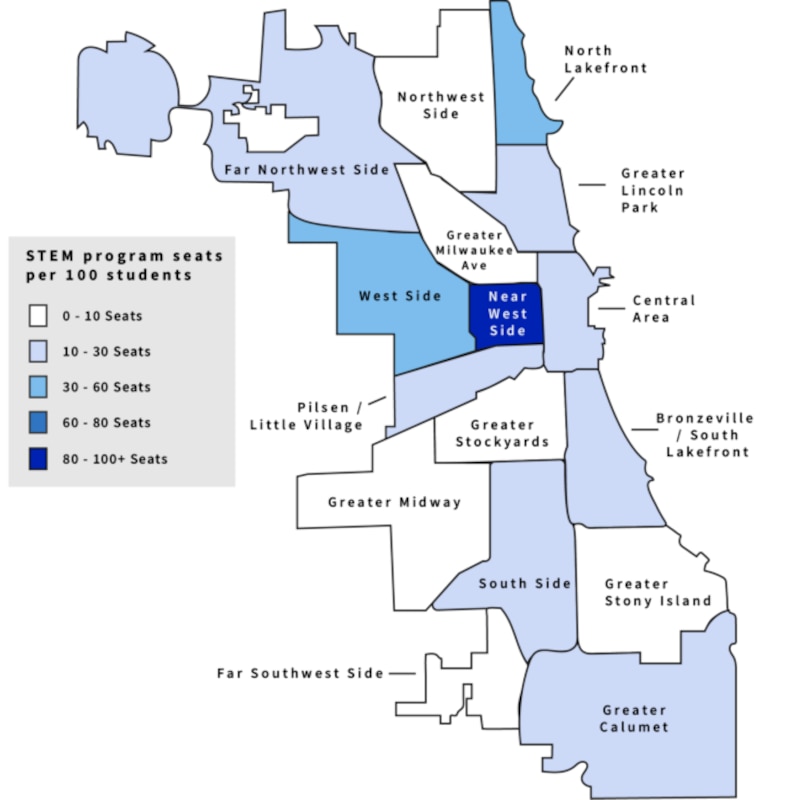
STEM programs are more evenly distributed across Chicago than both IB and selective enrollment schools, yet whole swaths of the city lack them, especially on the South Side, including the Greater Stony Island region, which includes far South Side neighborhoods like Roseland, Chatham, Greater Grand Crossing and South Shore. As the other maps show, that region lacks most of the high-demand academic programs the district has to offer.
Racial disparities in school quality
The analysis also shows disparities in quality of schools, not just variety.
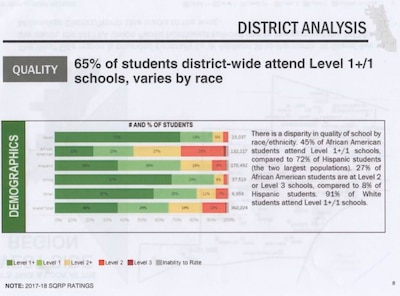
At CPS, 65 percent of students districtwide are enrolled at Level 1-plus or Level 1-rated schools. But only 45 percent of black students and 72 percent of Latino students are in those top-rated seats, compared with 91 percent of white students.
The disparities are even more severe given that the school district is mostly Latino and black, with fewer than one in 10 students identified as white.
In the Greater Lincoln Park region, 100 percent of elementary schools have one of the top two ratings — the highest concentration of them in the city. The highest concentration of top-rated high school seats, 91 percent, is in the Central Area, which includes Downtown and the South Loop.
The lowest concentration of top-rated elementary seats, 35 percent, is in the Near West Side region, and the lowest concentration of high school seats, 14 percent, is in the West Side region.
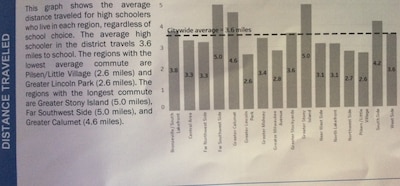
Long commutes from some neighborhoods
The number of students choosing schools outside their neighborhood boundaries has increased in recent years.
But the report shows that school choice varies by race: 44 percent of black students attend their neighborhood elementary school, compared with 67 percent of Latino students, 69 percent of white students, and 66 percent of Asian students. For high schoolers, only 14 percent of black students attend their neighborhood school, compared with 28 percent of Asians, 30 percent of Latinos, and 32 percent of whites.
More students enrolling outside their neighborhood attendance boundaries means more and more students have longer commutes, but how far they travel depends on their address.
Again, this is an area where the Greater Stony Island area stands out.
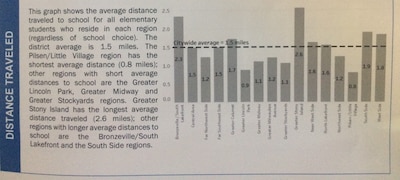
The average distance traveled for elementary school students is 1.5 miles — but K-8 students in Greater Stony Island travel an average of 2.6 miles. The average distance to class for high schoolers citywide is 2.6 miles, but students in the Greater Stony Island region travel an average of 5 miles, about twice the city average.
Looking forward
The introduction to the Annual Regional Analysis describes it as “a common fact base” to understand the school landscape. It clearly states the intent of the report is to assist with district planning, not to provide recommendations.
It still bothers Wendy Katten, founder of Raise Your Hand, who has seen the report and said it tells little about how kids are actually learning at schools.
“It sounds like some data a company would use to reduce inventory at a manufacturing plant,” she said.
Gaete with Blocks Together said the numbers in the report are also missing important context about how the proliferation of charter schools, a lack of transparent and equitable planning, and a lack of support for neighborhood schools in recent decades has exacerbated school quality disparities across race and neighborhoods in Chicago, one of the nation’s most diverse but segregated cities.
It’s unclear when the final study will be published, or how exactly the school district will use its contents to inform its decisions and conversations with communities.
But an event posting on the website for Forefront, a membership association for “nonprofits, grantmakers, public agencies, advisors, and our allies,” mentions a briefing for the report on Oct. 10.
Kids First Chicago CEO Dan Anello and CPS Director of Strategy Sadie Stockdale Jefferson will share the report there, according to the website.