
Alexander Ooms reflects on what Colorado schools’ growth scores tell us about student performance, and what they do not.
Let’s start with something on which everyone should agree: metrics are neither inherently good nor inherently evil. They are simply calculations — ticks on a stick that measure time, distance, speed, place, or other attributes. All measurements can be used well or poorly and most disagreements are not about the number, but about the use.
For many years education metrics were predominantly based on proficiency: how close is a student to a specific standard. However the misunderstanding and misuse of proficiency metrics have led to a number of consistent abuses: assigning relevance to trends over time using different cohorts (e.g. this year’s sixth grade vs. last year’s sixth grade) or discrete standards (third grade math compared to 10th grade math). In particular, many users of proficiency data commit the cardinal sin of comparing the performance of schools with vastly different demographics.
The new favored metric in education is growth percentiles (which measures change in an individual student or cohort over a year’s time). And the ability to measure student growth is a significant milestone and provides an incredible amount of value and insight. Growth percentiles are also adjusted to group students with similar academic histories, making comparisons far more valid. But, like proficiency before it, growth is often misunderstood and misapplied, and is routinely cited as evidence for conclusions that it does not support.
My criticism here is not the metric, it is how the metric is being used (and my comments are limited to the Colorado Growth Model, where “growth” as commonly used refers to median growth percentiles). Here are some of the primary issues with the use of growth percentiles in Colorado.
1. The baseline is inadequate to the goals.
Growth percentiles are a norm-referenced measure: every year, the Colorado Department of Education calculates a median growth percentile of 50 for every grade and subject. A score of 50 is a reference point (the median) for a group: half the students are above and half below. Schools and districts then compare their progress against that achievement baseline, with the general belief — perpetuated by districts and media — that growth above 50 is a good result.
But a median growth percentile of 50 reflects a trajectory of student outcomes that are wholly inadequate: in 2013 just half of Colorado 10th grade students were proficient, a result not significantly different that it was a decade ago. We would never sanction using as a baseline a health metric that resulted in half our kids diagnosed as malnourished as they enter adulthood. A growth score of 50 is satisfactory only if you want the same outcomes: roughly half our kids exiting public K-12 education unable to read, write, and do math at a 10th grade level.
2. Growth cannot solve the equation most people ask it to solve.
Many people believe that growth percentiles can be used to measure both progress and performance: progress to determine how quickly a group (a class, school, or district) is moving towards a fixed goal, and performance to compare this metric to other groups. This is a common assumption, and it is false.
One of the architects of the Colorado growth model, for whom I have great respect, penned a very cogent essay where he states that increasing achievement “simply comes down to rate, time, and distance.” This is an equation most reasonable people believe we should be able to solve. But rate, in this equation, is not what growth percentiles measure. Like time and distance, rate is criterion-referenced: a score measured against a specific standard. Median growth percentiles are norm-referenced. The equation does not hold: one simply cannot solve criterion-referenced equations using normative variables.
To continue the race metaphor common to the discussion: we have the distance to a standard and the time of the remaining school years – but growth percentiles do not measure speed, they measure place. If the standard is a 10-minute mile and all Colorado eighth graders run a mile, a median growth percentile of 54 means that a student finished equal or better than 54 percent of students running the race. It does not mean she finished in a specific time.
See the problem? Growth percentiles are a relative measurement to a peer group. It means a lot if you finish in the top 20 riders at the Tour de France; it means less if you do so at the Tour de Fat. Growth percentiles are being used as an absolute metric when they are normative: yes, we know that kids finishing above 50 are moving faster than those below 50, but looking only at growth percentiles means we don’t know if kids are getting closer to the standard. Growth percentiles cannot tell us a student’s speed, but only if they are moving faster or slower than their peers.
Now Colorado also calculates a separate metric, known as adequate growth, which is criterion-referenced and is the annual score a student needs to reach proficiency. Adequate growth tells us the rate students require to reach a standard in a fixed period of time. But adequate growth suffers from the same problems as other criterion-referenced metrics and it should not be used to compare different groups.
Adequate growth scores depend enormously on the academic level where the student or cohort starts, which varies considerably. In Denver the range of adequate growth for fifth grade math among different schools ranges from 11 to 92. To reach proficiency in secondary grades, some students need to run a mile, some need to run a marathon. You can have a race where everyone starts at the same place and then measure relative performance after a year. You can have a race where everyone starts in a different place and calculate the speed each student needs to reach the finish line at the same time. But these are two separate races — two different equations — and they cannot be solved by one metric. In assessing students, there is no single measure of growth that allows us to gauge both absolute progress and relative performance.
3. Growth slightly above the median does not mean proficiency will increase.
To make this conversation even more complicated, remember that proficiency standards become harder every year. Proficiency in third grade is easier than proficiency in 10th grade. What this means is that one can have growth percentiles above 50 for several consecutive years while proficiency rates decline (as seen in this chart).
There are many good reasons for this: proficiency is binary while growth is continuous. Lots of schools do good work getting students closer to proficiency, or keeping them proficient at the harder standard. Both efforts are reflected in growth percentiles, however neither will change student proficiency.
Yet we have districts and schools who believe that growth percentiles slightly above 50 mean they are making progress on proficiency. That is circumspect. These schools are doing well only in a relative sense: they are doing well compared to other Colorado schools and districts; they are not doing well in preparing students for college and career. Doing better than most participants in the Tour de Fat does not prepare one to ride the Tour de France. We are doing a grave disservice to the future of our students when schools and districts celebrate growth scores that are only marginally better than the State median.
4. Score distributions matter.
With growth percentiles, in addition to where you place what matters is how far you are from everyone else. Is the difference between finishing first and finishing last one minute, or one hour?
Score distributions are often measured by using standard deviations (SD). Again, the growth model calculates a median for every grade and the three main subjects — 21 variables in all. But there are huge variances in standard deviations which we have to take into account when comparing growth percentiles.
Here is a wager I will make until the end of time: the highest growth percentiles are going to be in math. How can I be sure? Because math consistently has a higher standard deviation. Indeed, in 2013 across Colorado at the school and grade level, 11 of the highest 12 growth percentiles were in math, including the highest score in every single grade. You want to get a high growth score? Be a math teacher.
But the high scores of math teachers do not mean they are doing better than their peers in other subjects. For example, in Denver Public Schools in 2013, sixth grade math had a SD of 20 points; 10th grade reading had a SD of less than 8 points. In DPS a sixth grade math growth percentile of 70 and a 10th grade reading growth percentile of 59 are roughly equal (both are 0.5 SD above their respective DPS average). Growth percentiles vary a lot by subject, and somewhat by grade. If we are comparing the growth scores of schools and teachers serving different grades, one needs to adjust them accordingly.
5. Growth is means, not end.
If a school or district believes that its primary goal is relative — to outperform other schools and districts in Colorado — the growth model works just fine. But recognize that this is placing in a race where roughly 50 percent of the participants finish short of basic proficiency goals. If schools and districts believe their primary goal is absolute — to prepare their students for college or career success — they need to use proficiency criteria. In my opinion, a primary goal of schools and districts should be exit-level proficiency. And I believe that, used properly, growth percentiles are a useful metric to help us reach this goal. But growth percentiles are a means, not an end.
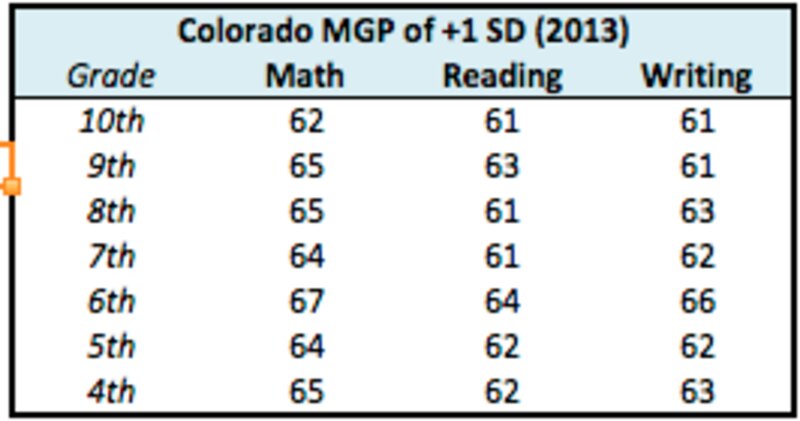
Measured over a large population, consistently high growth percentiles should lead to higher proficiency. But in the current landscape of Colorado, my sense is that this probably requires growth percentiles of at least one standard deviation above average for each subject and grade, which are listed in the table below (excluding AECs). Schools who consistently achieve at these levels will increase their number of proficient students. These schools exist, but they are obscured by the current championing of growth percentiles that do little more than merely perpetuate the status quo of underachievement.
Lastly, given the political nature of the debate, essays like this one are often taken out of context. So let me be clear: Growth scores are important and worth our attention. They reflect positively: a high growth score (especially controlled for subject and grade) is better than a low growth score. Schools with high growth are, in general, providing more academic value than those with low growth. Growth provides a badly needed dimension, and is helpful to compare the relative performance of individual schools and districts.
But just as there is much growth can tell us, there is much it cannot. Many people are now using growth percentiles where they simply do not fit, and as anyone who has tried to turn a screw with a hammer should know, tools have to be used appropriately or the resulting structure is often unsound. When using growth percentiles, we need to take a lot more care.
About our First Person series:
First Person is where Chalkbeat features personal essays by educators, students, parents, and others trying to improve public education. Read our submission guidelines here.