Compared to other large, urban school districts, Denver has among the biggest achievement gaps in the country between white and Hispanic students in reading and math.
That’s according to data released Monday from the tests known as “the nation’s report card.” The tests are given every two years to a sample of fourth and eighth graders in each state. Scores from 27 urban districts, including Denver Public Schools, are reported separately. This is the first year Denver’s scores have been broken out that way.
Denver scored roughly in the middle of the pack of the 27 districts, with its students posting slightly higher than average scores in reading and slightly lower than average scores in math. English language learners in Denver did particularly well on the tests.
However, the results also highlight a well-known problem: Most of Denver’s achievement gaps between more privileged and less privileged students were bigger than average. In some cases, the differences were large enough to be statistically significant.
Those included the gaps between white and Hispanic students. More than half of Denver students are Hispanic. About a quarter are white. Results show that white students in Denver did particularly well on the tests, outscoring white students in the state and the nation.
That trend mirrors Denver’s results on state standardized tests, and district officials say it’s one reason why the achievement gap between white students and students of color is so large.
Denver also had larger than average gaps between students who qualify for free and reduced-price lunch, a proxy for poverty, and those who don’t in fourth- and eighth-grade reading and fourth-grade math. Superintendent Tom Boasberg said these latest scores confirm that Denver Public Schools needs to continue to focus on closing its gaps.
“That’s our number-one priority,” he said.
The 27 urban districts are part of what’s known as the Trial Urban District Assessment, or TUDA, which began in 2002 with six districts and has steadily grown. Denver officials wanted to join the group to be able to judge how Denver students score on the National Assessment of Educational Progress, or NAEP, tests compared to students in other urban districts.
In math, 28 percent of Denver fourth-graders and 26 percent of eighth-graders scored proficient or better. In reading, 29 percent of both fourth- and eighth-graders scored proficient or better.
Being part of the group also allows Denver to compare its scores to Colorado statewide scores. Denver students scored lower than Colorado students in both grades and both subjects, and most of Denver’s achievement gaps were bigger than Colorado’s achievement gaps.
But much like the trend with white students, English language learners in Denver outscored English language learners statewide in reading and math. They also outscored English language learners nationwide in reading. Denver Public Schools has for years been under a court order to improve instruction for students whose first language is not English.
Boasberg characterized the scores of Denver’s English language learners as a bright spot. A decade ago, they were underperforming their peers in Colorado and nationwide, he said. The progress, he said, is “a credit to the work that our teachers are doing.”
Overall, Boasberg said district officials were expecting Denver students to score higher on the NAEP tests, given their performance on state standardized tests. Colorado has been part of a testing consortium called PARCC along with a dwindling number of other states. Being part of a consortium allowed Colorado to compare its results with the other states.
Four of the 27 urban districts were also part of the PARCC consortium. As such, Denver officials were able to compare both PARCC and NAEP scores with those four districts. The comparisons show that Denver students did better on PARCC than students in Albuquerque, Baltimore, Chicago, and Washington, D.C., but more on par with them on NAEP.
“That was surprising,” Boasberg said. “Based on how our students did on PARCC, we were surprised when we saw performance that was less strong on NAEP.”
He said he doesn’t know why, but the district is digging into possible reasons.
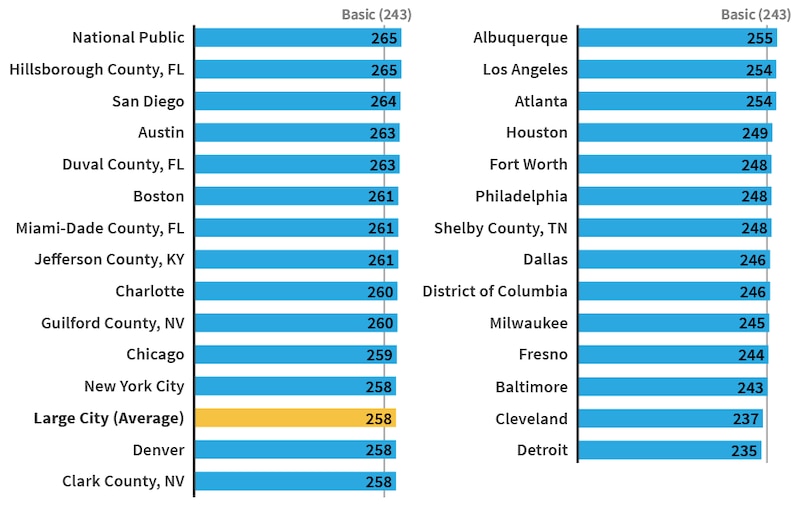
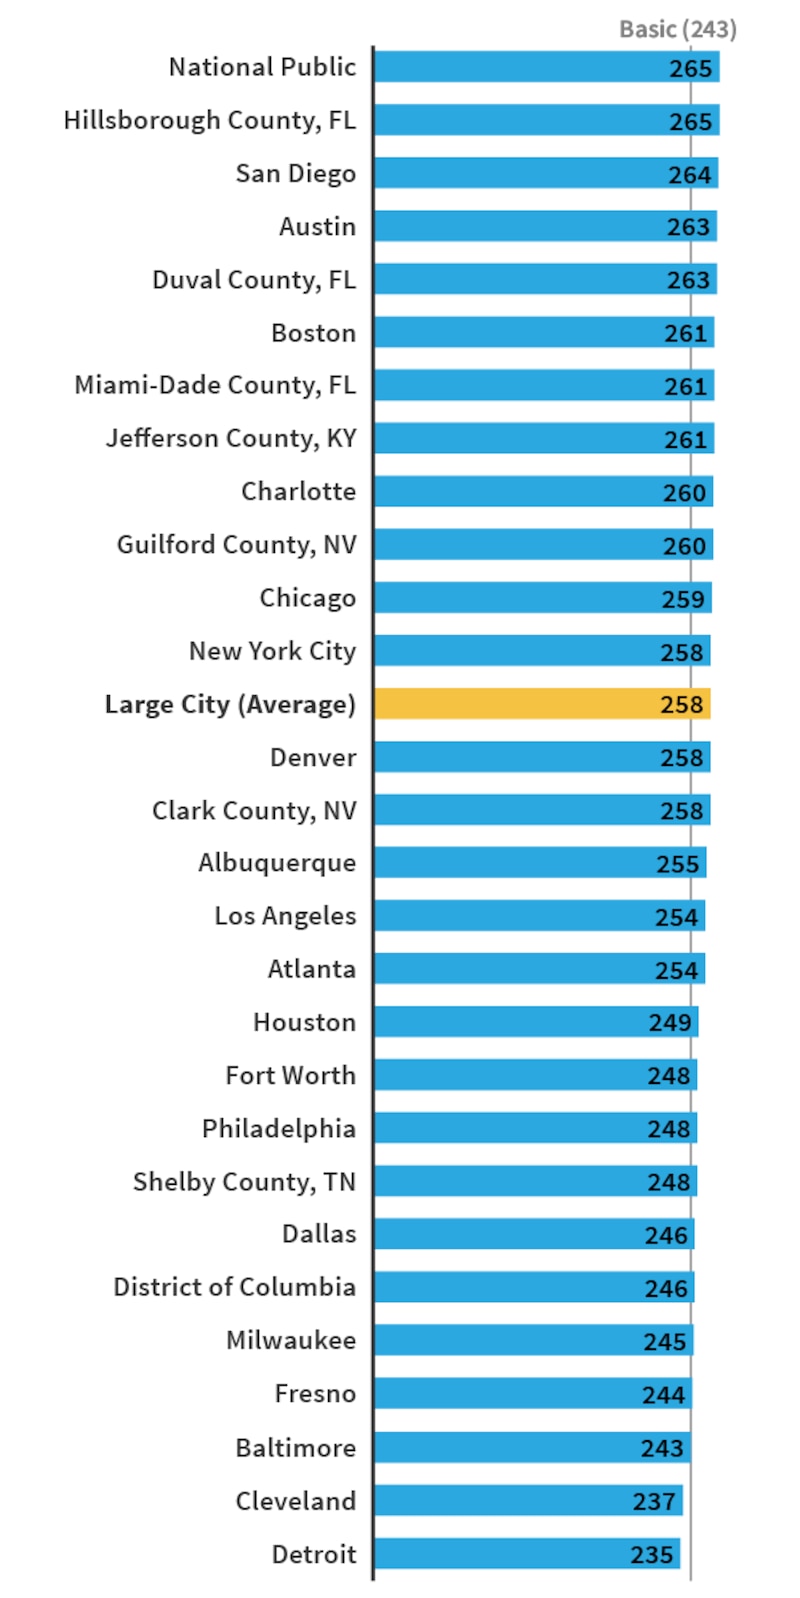
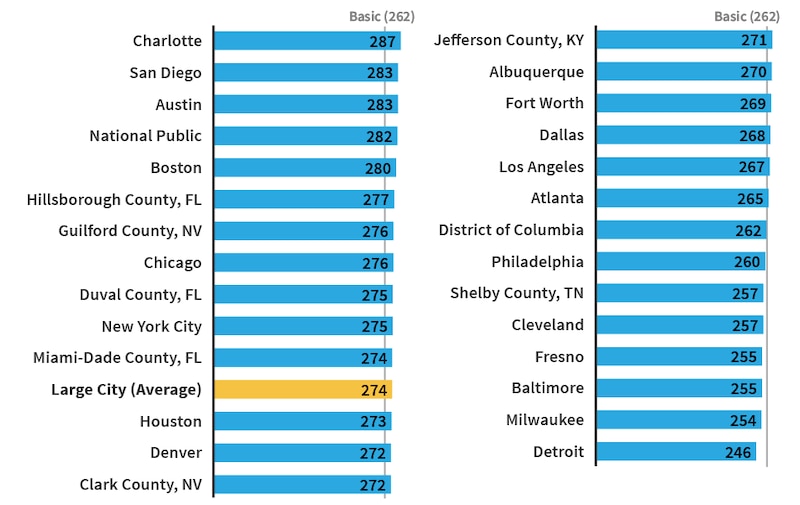
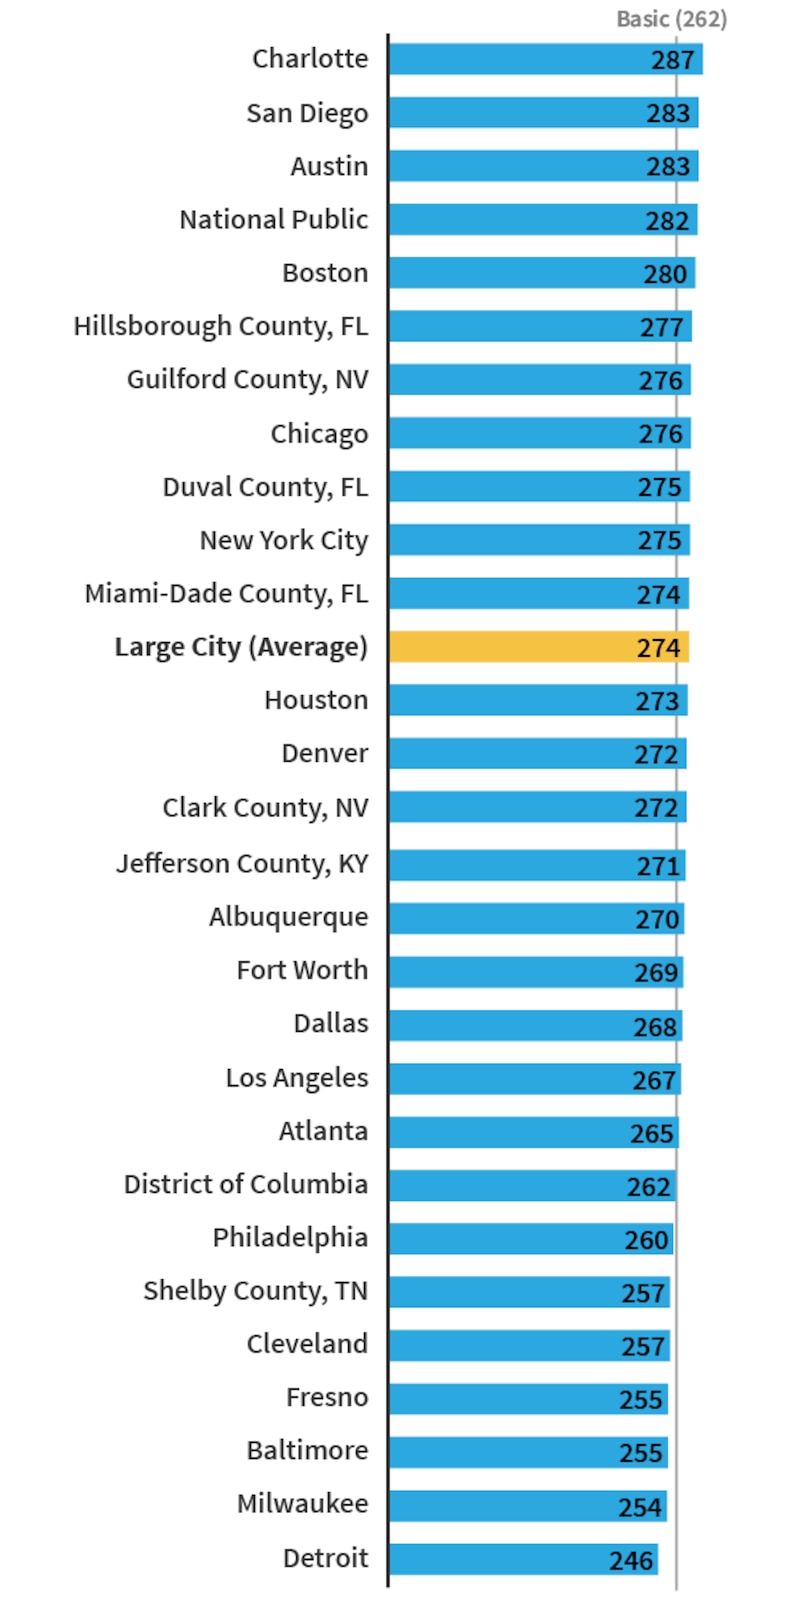
2017 NAEP Trial Urban District Assessment Rankings for 4th Grade Math
2017 NAEP Trial Urban District Assessment Rankings for 8th Grade Math
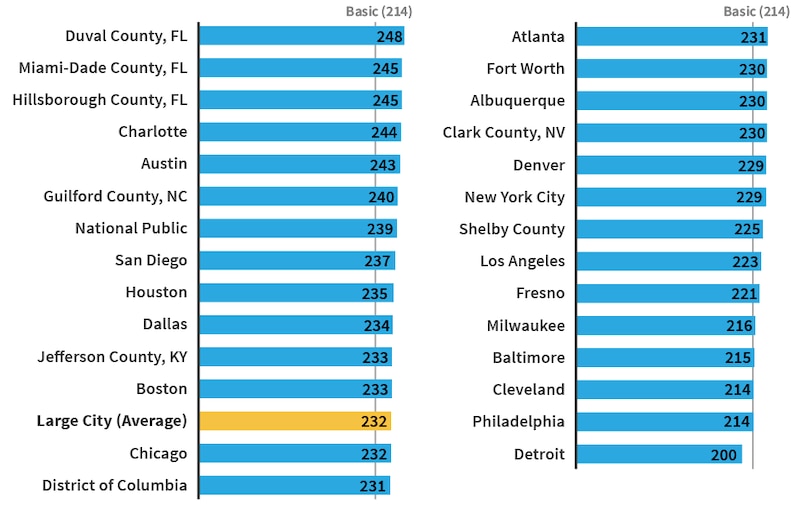
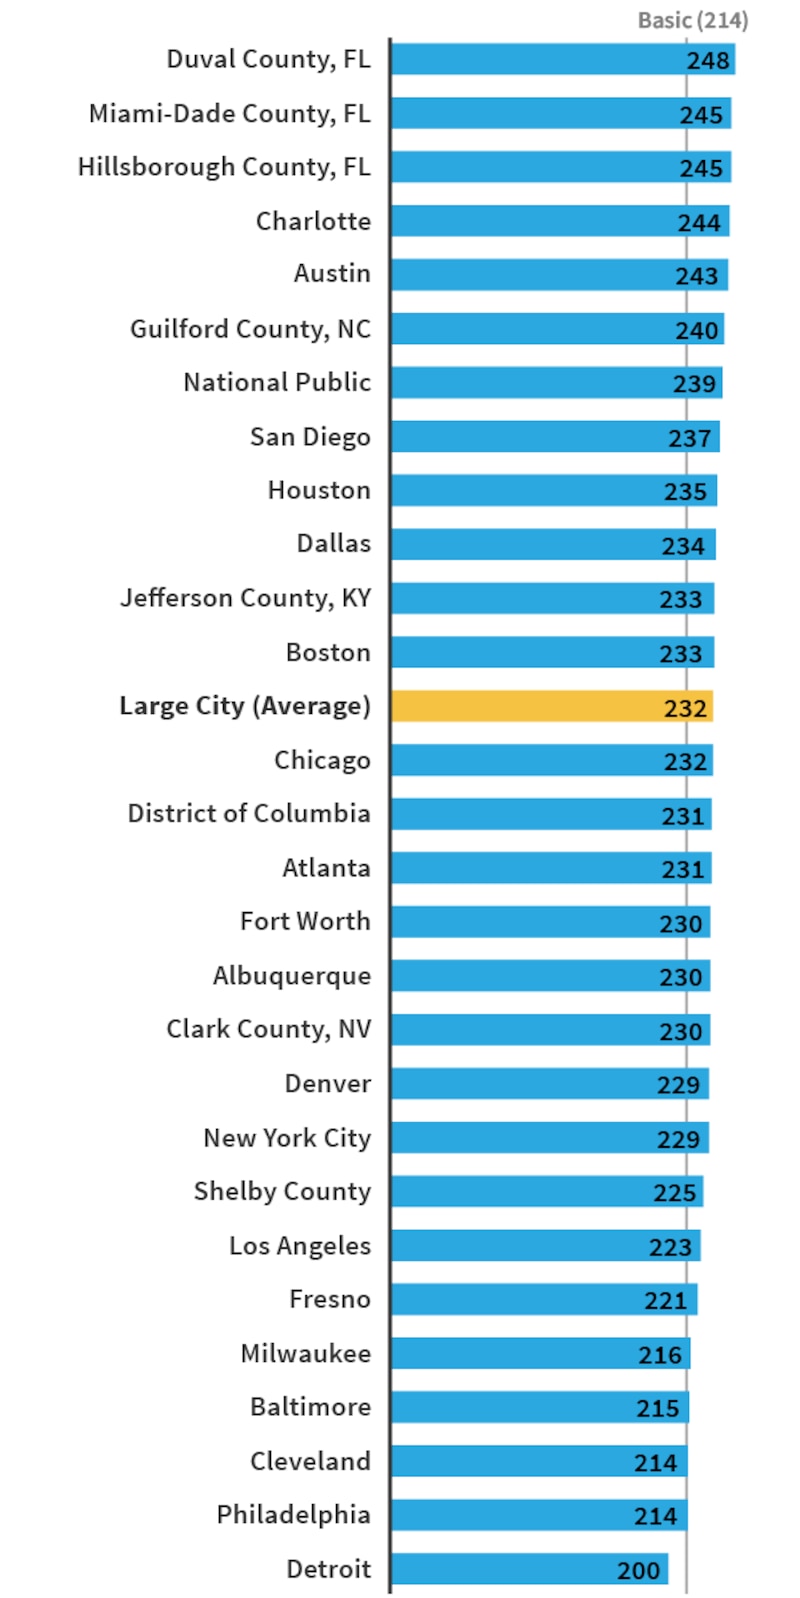
2017 NAEP Trial Urban District Assessment Rankings for 4th Grade Reading
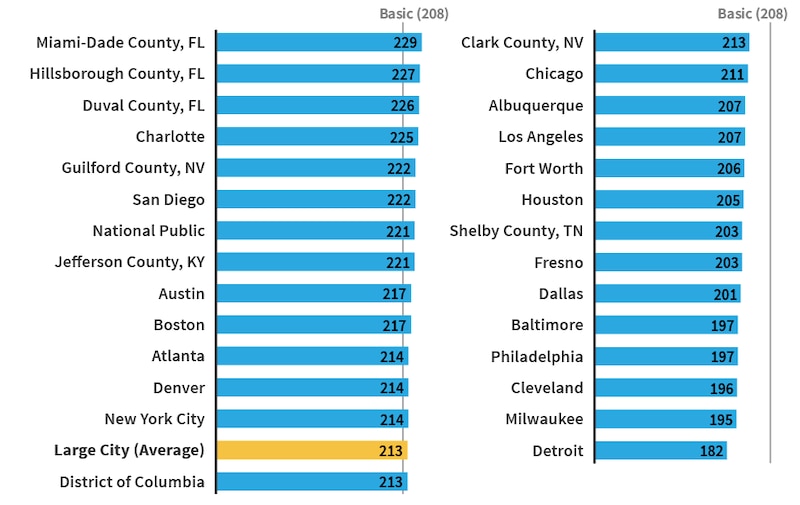
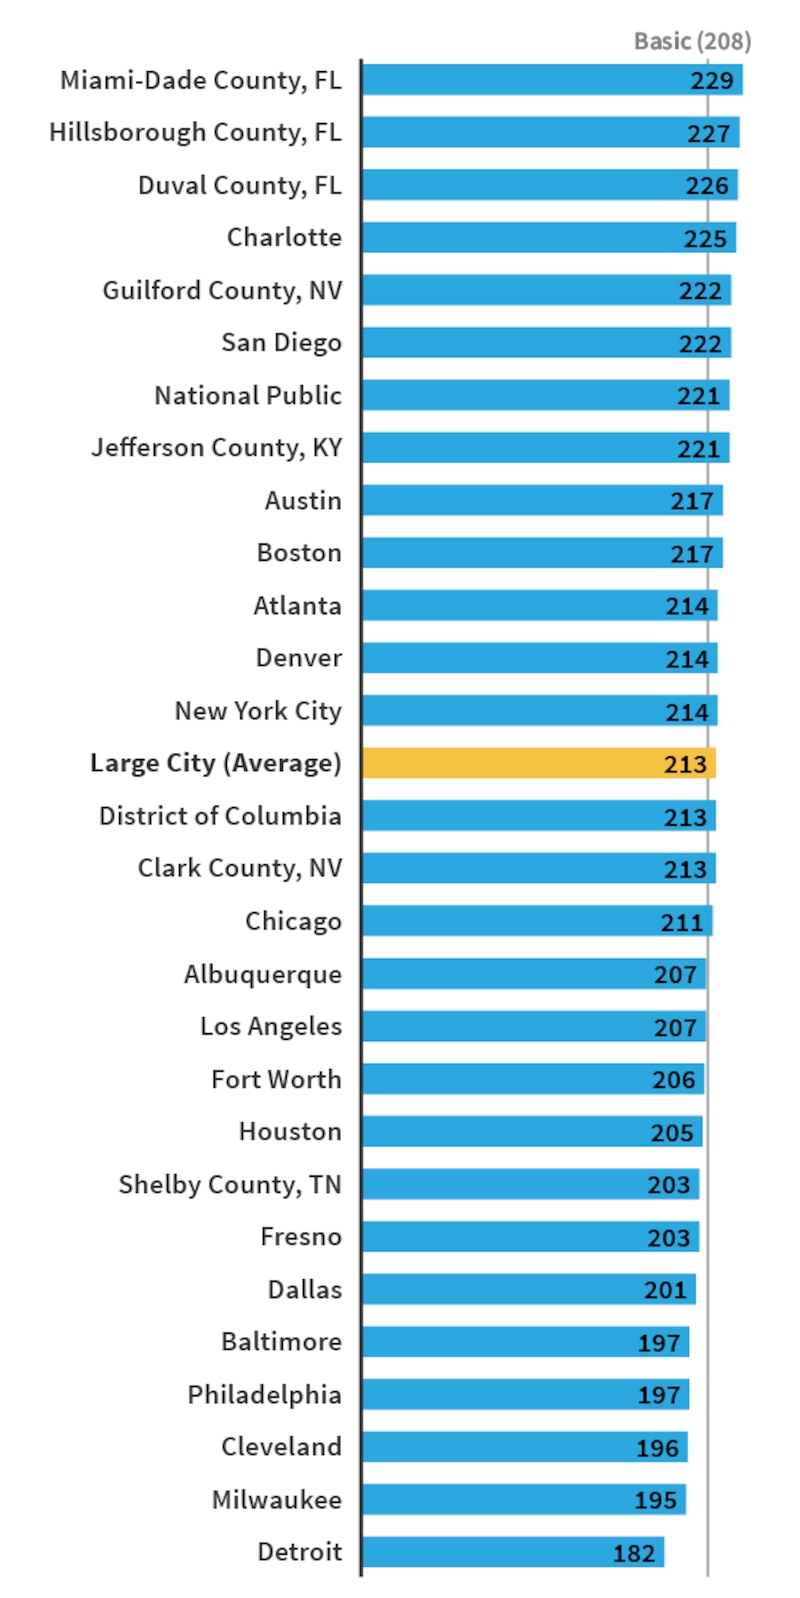
2017 NAEP Trial Urban District Assessment Rankings for 8th Grade Reading