
Michigan parents now have a new way to know what’s happening in their local schools.
State education officials on Tuesday unveiled their new “data dashboard” that allows parents to a see a host of information about individual schools on a single computer screen including test scores, graduation rates, attendance rates, as well as the percentage of graduates who’ve enrolled in college.
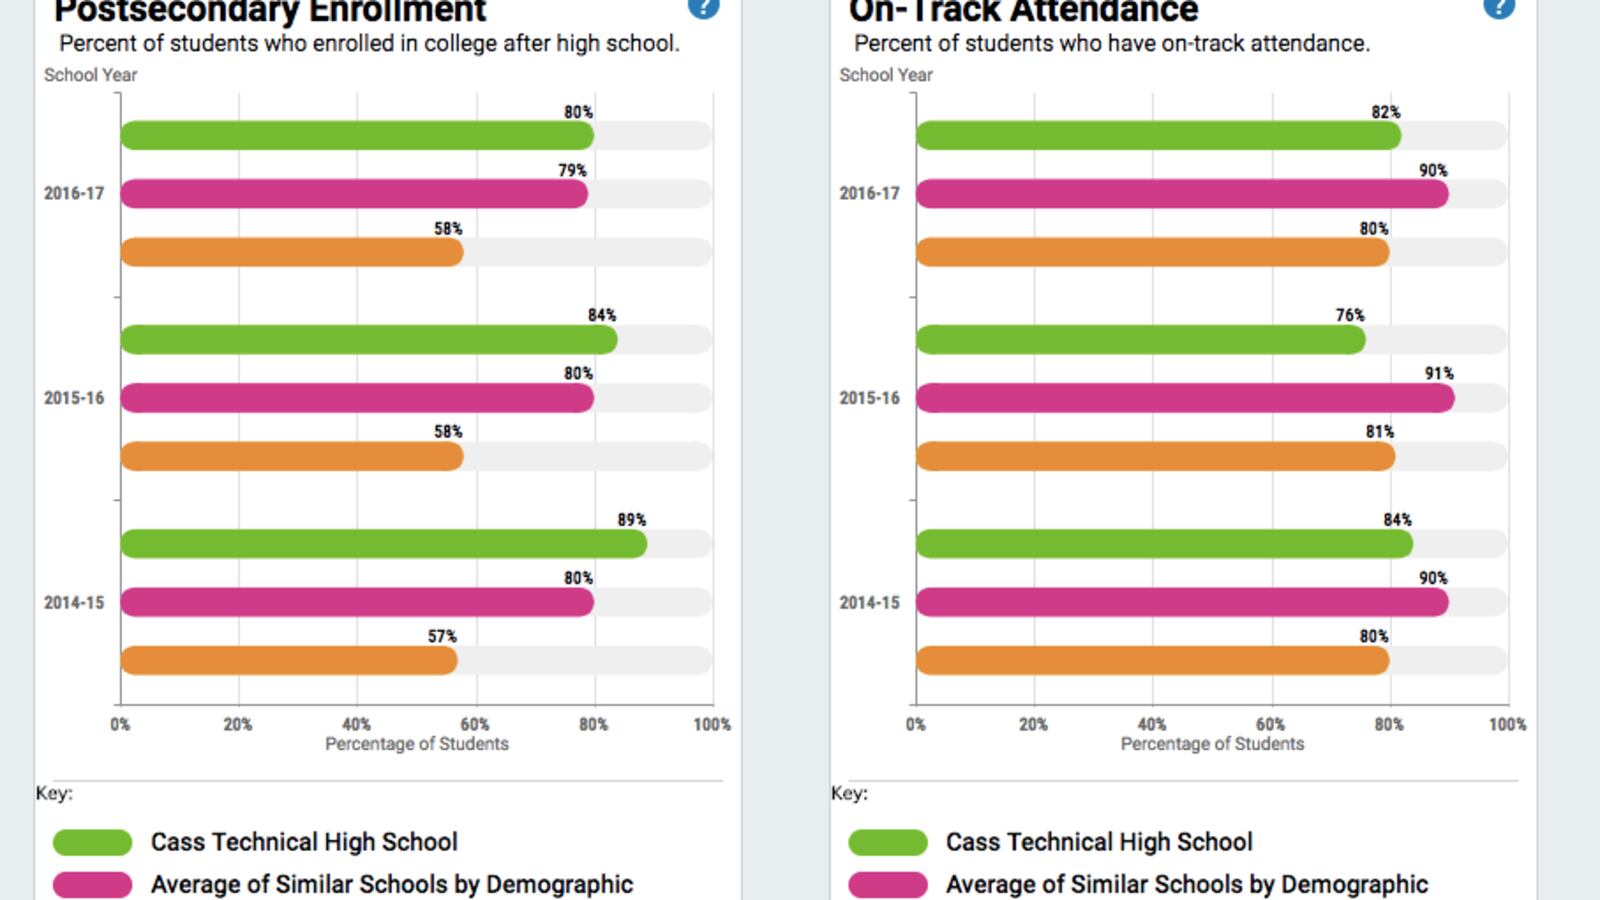
Users can click through to get answers about other school details, such as the ratio of students to teachers and the number of student expulsions, and can compare what’s happening at one school to statewide averages and to averages for schools with similar student populations. This is a helpful feature in a city like Detroit where most schools fall far short of the state average on state exams but could be outperforming the school up the street.
All of that information has long been available on the state website but the dashboard is designed to make it easier for parents to understand it, and to access it on mobile devices.
Michigan has lagged behind other states in making information easily accessible to families — a source of frustration for advocates who say families can’t benefit from school choice options, such as charter schools or opportunities in neighboring districts, without being able to easily compare one school to another.
The tool is Michigan’s answer to a new federal law that requires states to measure schools in different ways, going beyond just test scores to include things like attendance and suspension rates.
Some advocates have pushed the state to develop an A-F grading system that would make it easier for parents to compare schools. Some lawmakers have discussed legislation that would force the creation of a letter grade system. But state board of education members have backed the dashboard as an alternative.
The new dashboard allows users to see average test scores and graduation rates for all students at a school or for subgroups such as for children with disabilities.
The tool also lets users zero in on specific subjects such as math and science and to see trends over time.
See the dashboard here, read the state’s press release for more information, or watch a video featuring state superintendent Brian Whiston explaining how it works.
Whiston was not at the state board of education meeting on Tuesday where the dashboard was released. A board member said he was receiving radiation treatments for a recent cancer diagnosis but that he is still in charge of the state education department.