This story is part of a partnership between Chalkbeat and the nonprofit investigative news organization ProPublica. Using federal data from Miseducation, an interactive database built by ProPublica, we are publishing a series of stories exploring inequities in education at the local level.
Newark schools are suspending thousands of students, the majority of them black, according to 2015-16 federal data collected by the U.S. Department of Education’s Office for Civil Rights.
But because of reporting lapses, those suspensions are nowhere to be found in the state’s published school report cards, where parents typically turn to seek out such data. Instead, the reports give the false impression that Newark has all but eliminated suspensions.
The flawed reports reveal the district’s longtime struggle to track suspensions — a data challenge that has impeded efforts to stop schools from inappropriately removing students or punishing students of one race more harshly than others.
ProPublica has compiled the federal data, which many people never see, in a new user-friendly portal, allowing the public to explore racial inequities across districts and schools. Using the tool to analyze suspensions in Newark, Chalkbeat found stark disparities between schools and between students of different races — troubling patterns masked by the inaccurate state reports.
The state and federal suspension rates for individual schools differ dramatically, creating uncertainty about schools’ actual discipline practices. Current and former district officials say the federal data is more reliable than the state’s figures, which they attributed to reporting failures at the school level.
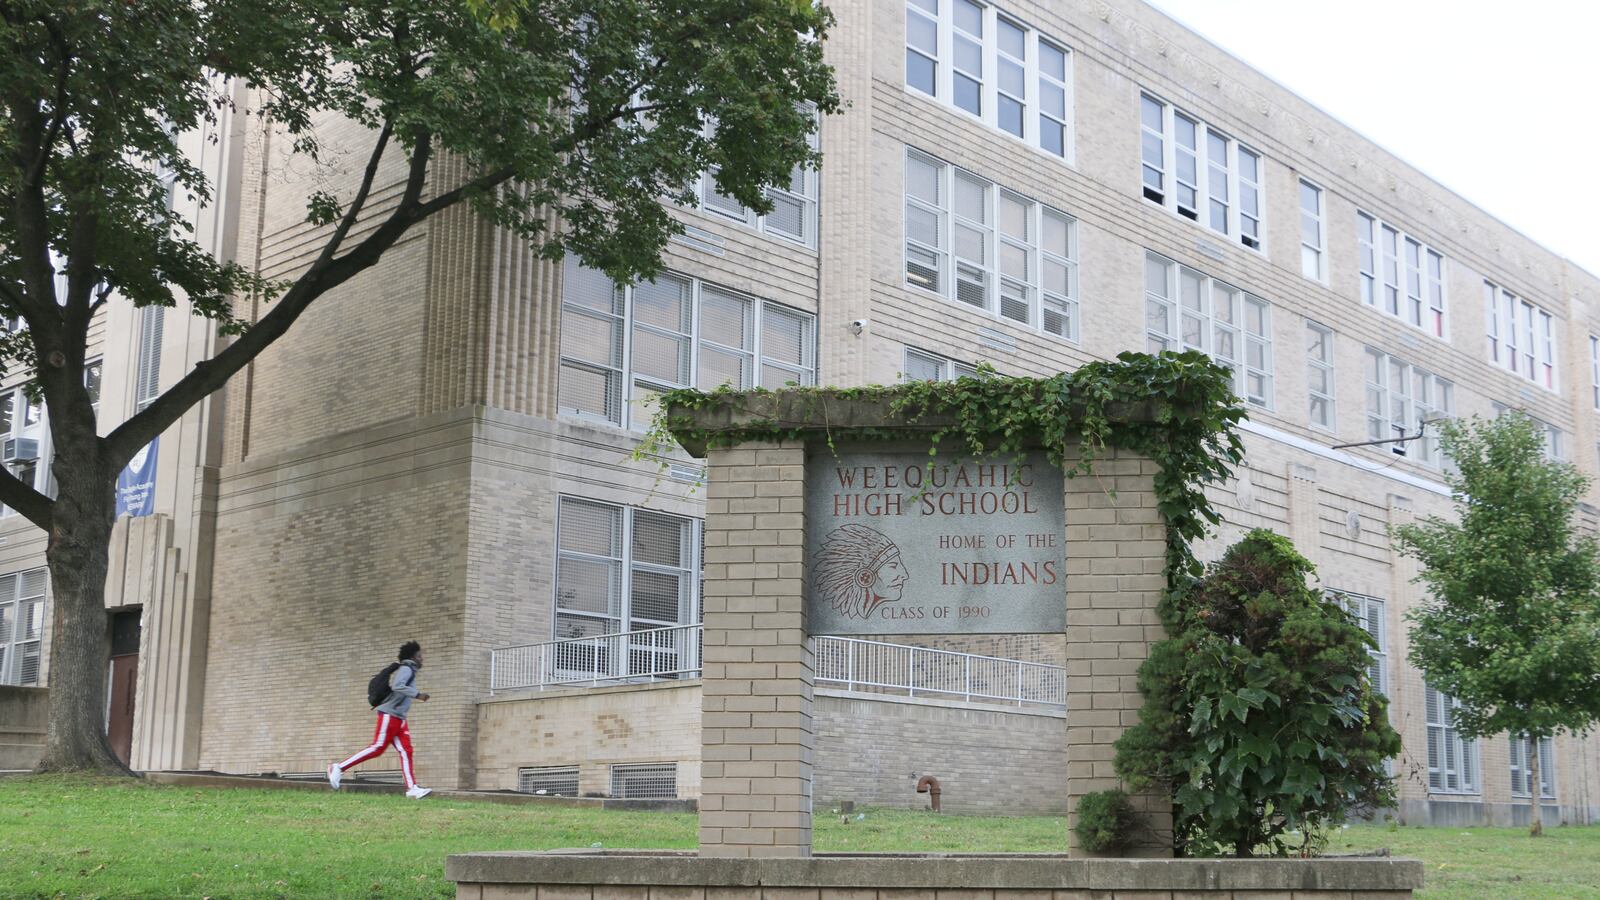
For example, the state’s 2015-16 “school performance report” for Weequahic High School in Newark’s impoverished South Ward says its suspension rate was zero. But the federal data indicate that Weequahic, where 98 percent of students were black, gave in-school suspensions to 233 students — an astonishing 70 percent of the student body. (In addition, 31 students received out-of-school suspensions.)
“You’d get suspended for anything,” recalled Daquis Henry, 18, about his freshman year at Weequahic. Henry, now a senior, said suspensions have become less common under the school’s new principal, but, in the past, the policy made him consider staying home.
“It’d be like all my friends are suspended,” he said. “What’s the point of me coming?”
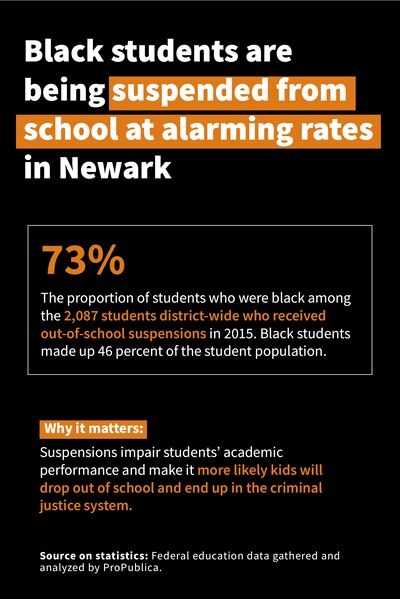
District-wide, 2,087 students received out-of-school suspensions in the 2015-16 academic year, or 6 percent of the total enrollment, according to the federal data. About 960 students received in-school suspensions, or 3 percent of the enrollment. (Students who received both types of suspensions are included in both counts.)
The state did not publish district suspension rates that year. But in 2016-17, it reported that 1.1 percent of Newark students received out-of-school suspensions, and 0 percent received in-school suspensions — an improbable number in a state where nearly 53,000 students were given in-school suspensions that year.
The federal data show that more than one-fourth of students who received out-of-school suspensions in 2015-16 hailed from just three Newark high schools, where the vast majority of students were black. The schools were Central, Newark Early College (now part of West Side), and Malcolm X Shabazz.
The state report for Shabazz indicated its suspension rate was 0.6 percent, but the federal data show it gave out-of-school suspensions to 246 students — or 44 percent of its student body. It also gave in-school suspensions, which the federal government defines as being removed from the classroom for at least half a day, to 161 students. (Damon Holmes, the school’s former principal, disputed those numbers, saying he recorded a 24 percent suspension rate that year — still about three times the statewide rate.)
If suspension rates are as high as the federal data suggest — or even close — the consequences for affected students are potentially grave. Research has shown that suspensions impair students’ academic performance, and that suspended students are more likely to drop out of school and become ensnared by the juvenile-justice system. (Six percent of Weequahic students and 14 percent of Shabazz students dropped out in 2015-16, compared to just 1.2 percent statewide.)
And Newark’s black students appear to be bearing the brunt of the district’s harshest punishments. In 2015-16, black students made up 73 percent of those who received out-of-school suspensions as well as 67 percent of students who were referred to law enforcement, which includes receiving a ticket or being arrested, although they accounted for just 46 percent of the overall enrollment.

By contrast, Hispanic students, who made up 45 percent of Newark’s district-school enrollment that academic year, represented just 25 percent of students who received out-of-school suspensions and 29.4 percent of those referred to law enforcement.
This racial disparity mirrors national trends, where black students make up 15.5 percent of the enrollment but 39 percent of suspended students, according to a Government Accountability Office analysis of 2013-14 data. The 28 percentage-point gap between enrollment and suspensions for Newark’s black students exceeds the 23.5 gap that exists nationally.
Andrea McChristian, an associate counsel at the New Jersey Institute for Social Justice, said the inaccurate state reports hinder efforts to pinpoint which districts and schools are pushing the most students out of class — and, potentially, into the criminal-justice system.
This gap and lack of transparency is especially troubling in light of New Jersey’s stark racial disparities in youth incarceration: Black youth are more than 30 times more likely than their white peers to be detained or committed to a juvenile-justice facility.
“We have to look at the reasons at the front end — what’s the funnel?” McChristian said. “The schools seem like a logical place to start.” But she noted, “It’s hard to quantify that without the data.”
The state’s annual report cards, which include Newark’s inaccurate suspension information, are designed to give the public a view of each school’s performance according to a range of metrics, including test scores and attendance. The reports are a critical tool for families in a “choice” system like Newark’s, where parents are encouraged to compare schools’ performance before ranking them on applications during the open-enrollment process.
However, the state relies on districts to provide much of the data in the reports, including suspension rates. The suspension numbers that Newark submitted were incomplete because many schools, until recently, did not log suspensions in the district’s online database, called PowerSchool, according to district officials.
“It was really a matter of reporting,” said Tashia Martin, a special assistant in the district’s Office of Student Support Services, which oversees discipline policy. “Some schools may not have been reporting in the way that they should have.”
Instead, some schools recorded discipline incidents and responses in third-party systems, such as Google Sheets. Beginning in 2016, the district began to retrain school personnel on how to input suspension data in PowerSchool, Martin said. The district has provided three trainings this school year on discipline policy, including data entry, she added.
“I’m confident that our numbers will be more accurate this year,” she said.
She and other officials said the federal data from 2015-16 is more accurate than the state reports because district officials gathered any missing data from schools.
“A few years ago, when we did not have the right protocols in place, and schools were doing whatever they wanted to do, we had to do a lot more legwork,” Martin said. Because of that “follow up with schools to collect the data, the CRDC report should be accurate,” she said, referring to the federal survey.
But even the federal data is incomplete, according to documents obtained by Chalkbeat.

In April 2017, Newark Public Schools officials informed the Office for Civil Rights that suspension data was “missing entirely” for two schools and “a few data elements” were unavailable for several other schools in the 2015-16 survey that the federal government collected. The district promised to “improve the consistency and comprehensiveness of suspension data” in the next survey, which is compiled every two years and will cover 2017-18, by retooling the district’s data system, training school personnel, and monitoring data collection, according to an “action plan” submitted to the federal agency.
The flaws in Newark’s responses to the 2015-16 survey came after the district failed to submit any data at all for the previous 2013-14 survey — making it one of only a few dozen districts out of 17,000 nationwide not to complete the legally required survey.
A U.S. education department spokesman did not immediately reply to inquiries about Newark’s survey responses. But in an email exchange last November with McChristian, the New Jersey Institute for Social Justice associate counsel, an official from the civil rights office said that Newark was an outlier.
“The CRDC is mandatory and we have very high response rates,” the official wrote. “However, there are always some districts that do not submit, for whatever reason. As an example, for the 2015-16 school year, there are 17,000+ school districts and only 34 did not submit data.”
Michael Yaple, a New Jersey Department of Education spokesman, said that districts have previously had to submit suspension data in different forms to the state and federal governments. The state has recently put in place a new data-reporting system that should result in fewer differences between the suspension rates reported at the state and federal level, he added.
“The NJDOE is working to continuously improve our data-reporting systems so residents can have better conversations in their communities about the needs of their students,” he said in an email. “In the next few years, the public can expect to see fewer discrepancies between the two collections.”
Lisa McDonald, who was principal at Weequahic High School in 2015-16, could not be reached for comment. The current principal, Andre Hollis, noted in an email that he arrived at the school in October 2017. He said he has tried to steer the school toward “restorative practices,” which are designed to help students reflect on their actions and make better choices rather than being sent out of school.
“We currently record suspensions in PowerSchool and use Restorative Practices to reduce the number of suspensions,” he said.
District officials said they review suspension data each month and follow up with schools that have unusually high rates or disparities between students according to race, gender, or special-education status.
However, the office that reviews discipline data has gone without a leader since June, when she and other top officials were forced out by the new superintendent, Roger León. Now, it falls on León to improve the district’s suspension reporting, whose challenges predate his administration.
“The fact that we’re in transition and these important questions are being asked is a good thing,” said Matthew Brewster, executive director of the superintendent’s office. “That helps us get to a place where we need to be.”
This story is part of a partnership between Chalkbeat and the nonprofit investigative news organization ProPublica. Using federal data from Miseducation, an interactive database built by ProPublica, we are publishing a series of stories exploring inequities in education at the local level.

