
As recently as 2009, Tennessee was considered a cellar dweller when it came to student performance on national tests known as the Nation’s Report Card.
Maps depicting student proficiency in math and reading showed Tennessee consistently scoring below basic on the National Assessment of Educational Progress, or NAEP — considered the gold standard of student assessments — even as neighboring states such as Kentucky, Arkansas and Mississippi fared better.
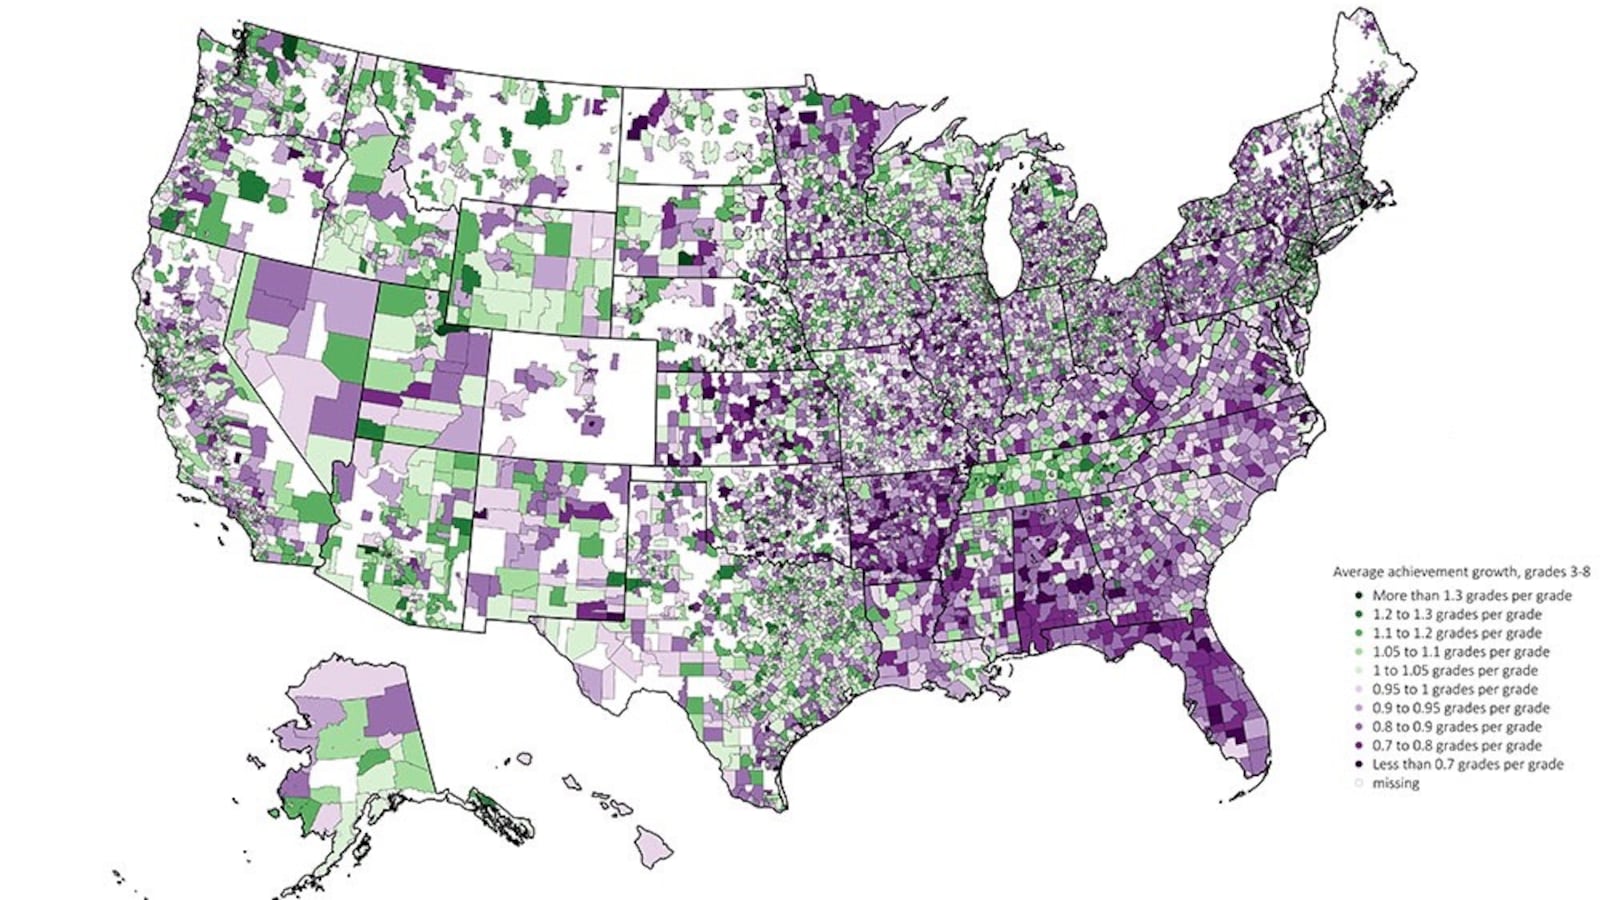
But now a new map based on a Stanford researcher’s analysis — showing high-growth districts in shades of green and low-growth districts in purple — has people talking, including Kevin Huffman, the state’s former education commissioner.
The analysis, released this month by Stanford’s Center for Education Policy Analysis, is the largest of its kind. Author Sean Reardon examined standardized tests taken by students across more than 11,000 school districts from 2009 to 2015. He used NAEP data to link the scores across states and controlled for differences on state tests by converting school performance to a common scale that measures growth in grade levels. Specifically, he looked at two things: 1) average student performance in third-grade math and English tests; and 2) student test score growth between the third and eighth grades.
Tennessee has never turned heads when it comes to proficiency on national tests but, based on several batches of NAEP scores and now Reardon’s map, it’s raising eyebrows on student growth.
“The first thing that jumps out at you on the map is: ‘Who is that little green rectangle in the middle?’ And that little green rectangle, of course, is us,” said Nakia Towns, Tennessee’s assistant education commissioner, during a presentation last week to a state task force on testing.
Reports on Reardon’s work have garnered Tennessee mentions in publications like The New York Times and this clear shout-out from Mother Jones: “Tennessee is a green oasis in the middle of a desert of purple. Someone should figure out what they’re doing right.”
Reardon says the green “suggests that there’s something behind the higher growth rates for Tennessee students than for students elsewhere in the Southeast. But it doesn’t tell us what caused it or why it happened.”
Tennessee officials are quick to pin the growth on a statewide overhaul of K-12 education grounded in higher academic standards, aligned assessments, and across-the-board accountability for districts, schools, teachers and students. That includes its controversial policy to incorporate growth from standardized test scores into teacher evaluations as part of the state’s 2010 First to the Top plan.
“We as Tennesseans made the right call — the tough call — on the policies we’ve pursued,” Education Commissioner Candice McQueen told Chalkbeat. “Nearly every other state has compromised in some way on some of these core foundational components of policy work, and we have not.”

She added that state and district leaders have collaborated to provide training and coaching supports along the way; educators have stepped up their game in the classroom; and two governors (one Democrat, one Republican) and multiple iterations of legislatures have stayed the course on Tennessee’s overall blueprint for improvement, even as major challenges have emerged.
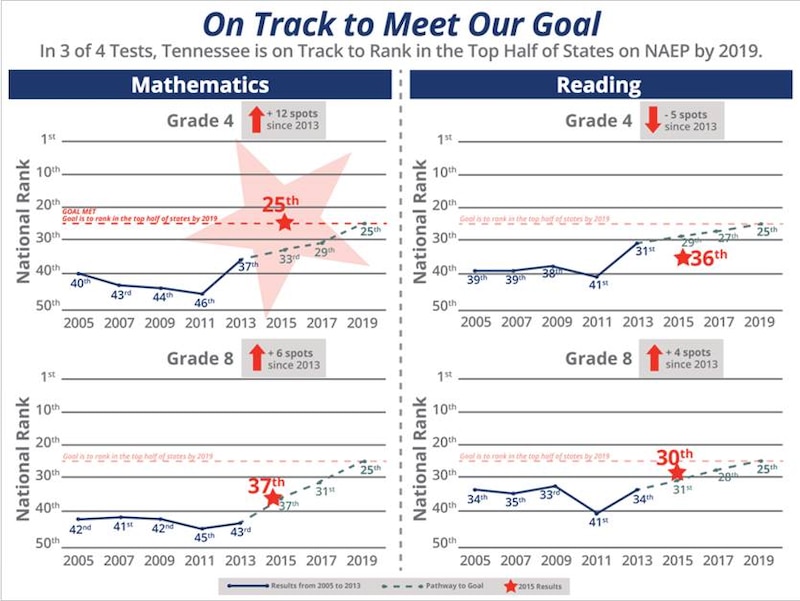
The Stanford analysis adds credibility to the consolation prize that Tennessee officials have touted since the release of 2013 NAEP scores. Tennessee is the nation’s fastest-improving state in math and reading, they say, even as some naysayers have questioned the superlative.
Since 2011, the state’s national ranking has risen from 46th to 25th in fourth-grade math, 41st to 36th in fourth-grade reading, 45th to 37th in eighth-grade math, and 41st to 30th in eighth-grade reading.
Now, Tennessee is waiting anxiously to see if this year’s NAEP scores, to be released early next year, will support that narrative and advance its goal of ranking in the top half of states by 2019.
In the meantime, Reardon’s analysis is helping districts compare their quality of education with their peers, and it’s highlighting school systems that are excelling in academic growth, including those in high-poverty areas. (His research was supported by several foundations, including the Bill & Melinda Gates Foundation, which also provides funding to Chalkbeat.)
“Tennessee’s average scores are lower than other states, but their growth rates are a little higher,” Reardon said. “That suggests that kids in Tennessee aren’t getting the same kinds of opportunities early on, but they seem to be having opportunities to learn from third to eighth grade.”
For Towns, who oversees data and research for Tennessee’s education department, the map shows in stark terms that it’s not just something in the water when it comes to her state’s student growth, particularly when comparing border districts with their counterparts just across the line in eight other southeastern states. For the most part, it’s green in Tennessee, purple across the line.
“These are people who go to church together, probably shop at the same WalMart, work together across state lines,” she said. “… There’s not a difference in the kinds of students served, but there’s a big difference in the (education) policy context.”
How effective was your Tennessee district?
Use the search box below to learn how much average student growth your local school district* achieved in five years.
*Shelby County’s listing is pre-merger and broken down as Memphis City Schools and Shelby County Schools (legacy); Metropolitan Nashville Public Schools is listed as Davidson County Schools.