Shelby County Schools has gotten its first marks on a national test considered the best way to compare student performance across locations — and the results aren’t good.
Compared to 27 large cities, the district landed in the bottom third of results from the National Assessment of Education Progress, known as NAEP. It also lagged far behind Tennessee’s scores — in which only about one-third of students met the basic standards for proficiency.
The results temper Tennessee officials’ frequently cited claim that the state’s students are improving academically faster than students in other states, but the state’s top education official said she was not surprised by Shelby County’s poor results.
The data was reported Tuesday from NAEP, a test given every two years that measures achievement among a sample of fourth- and eighth-graders across the country. Scores from 27 urban districts are reported separately. This is the first year Shelby County Schools has been compared with the other large urban districts.
NAEP is important because it has long been the only way to compare student performance across states, a distinction that has persisted even as many states adopted similar standards for what students should learn and begun testing students on whether they meet those standards. The exam, which is administered to a sample of students across each state and district, also serves as a check on state test scores.
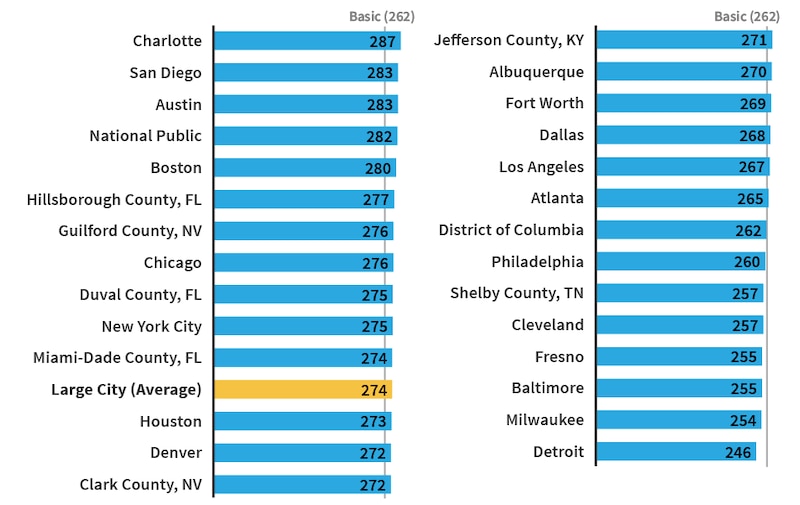
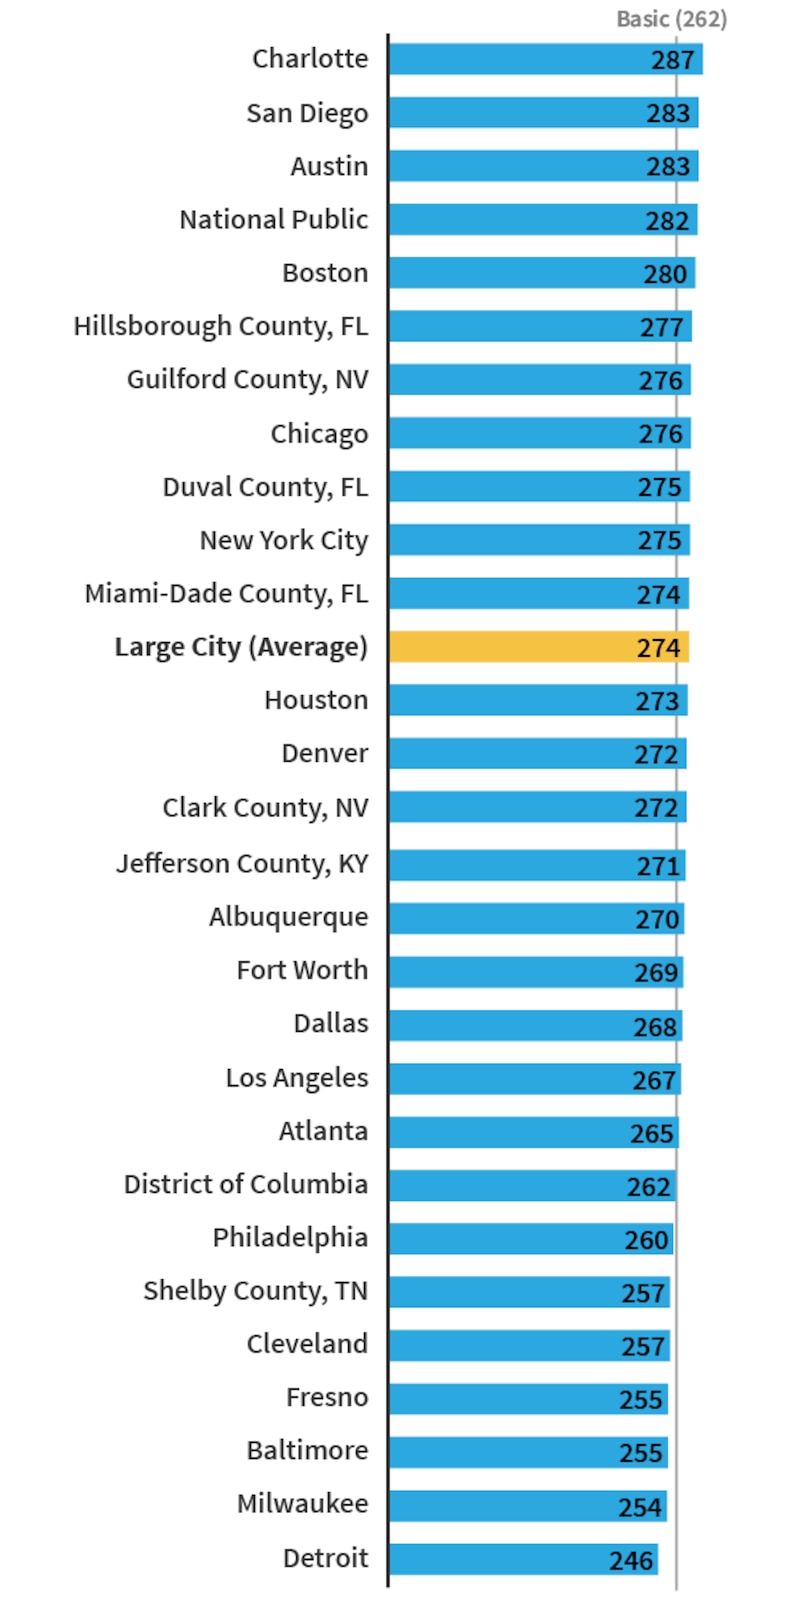
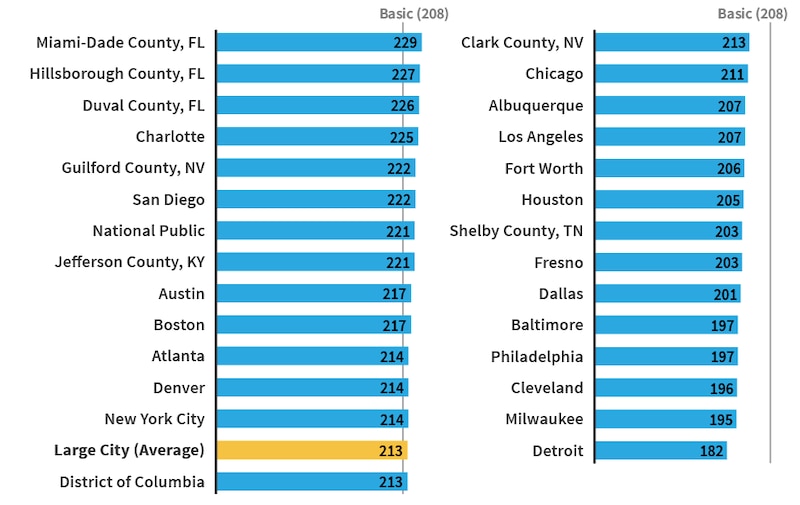
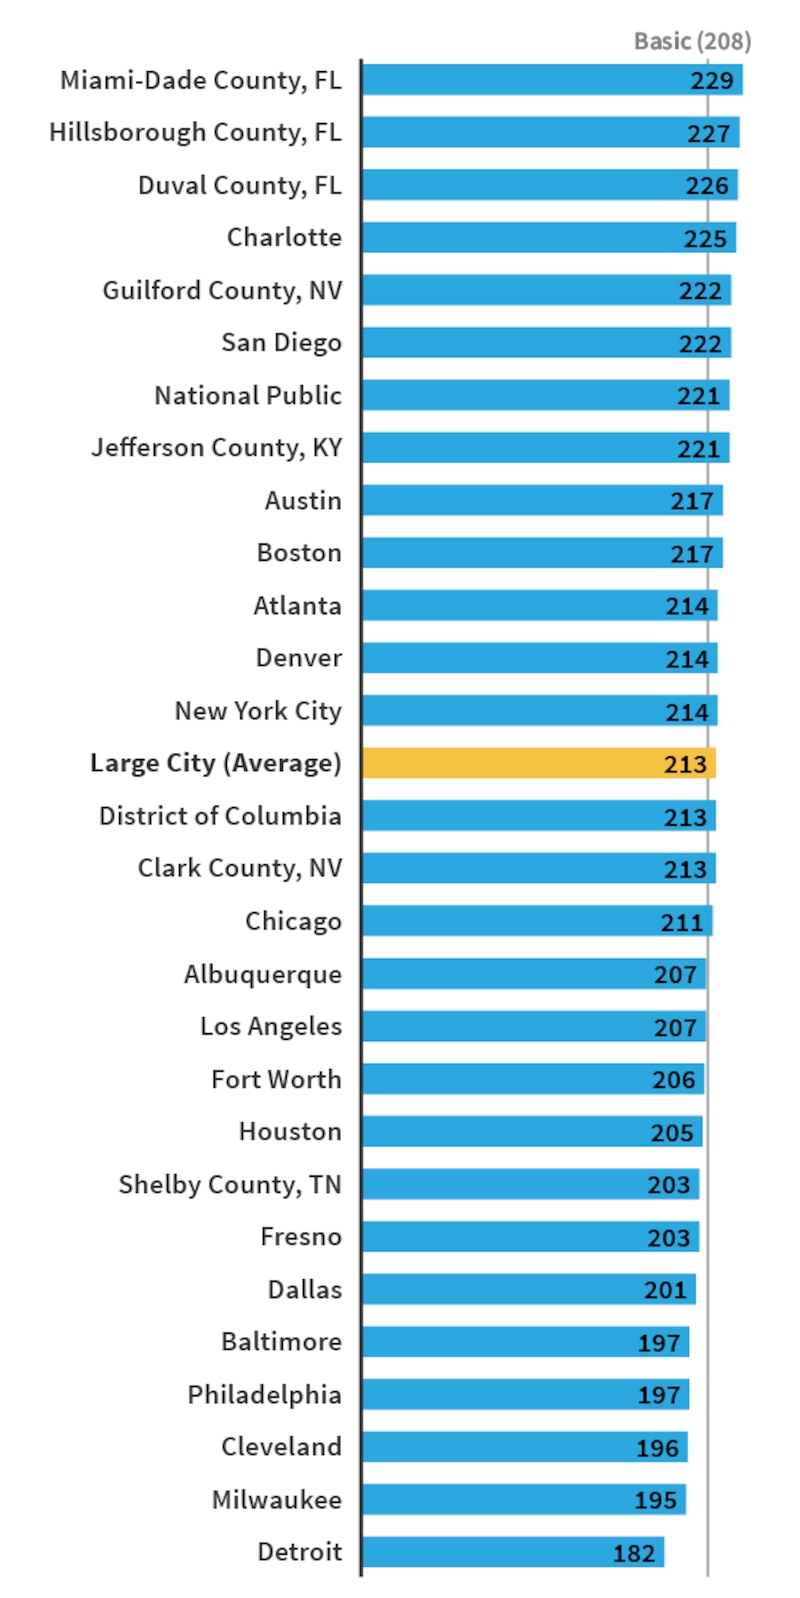
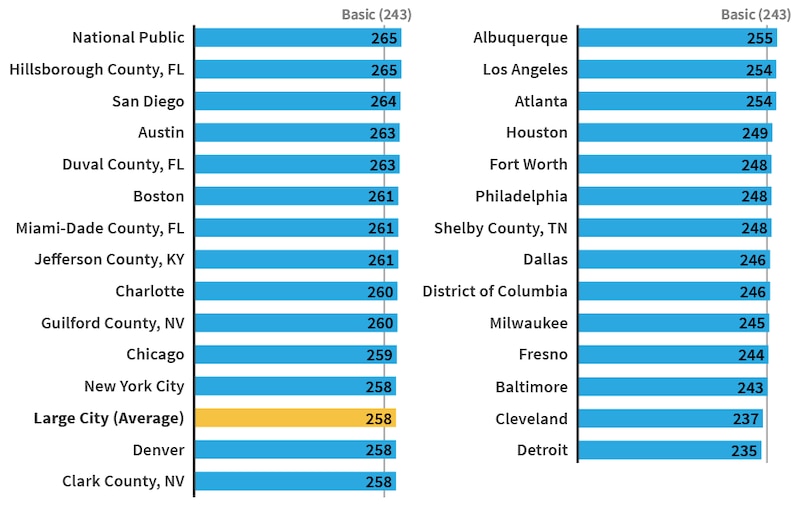
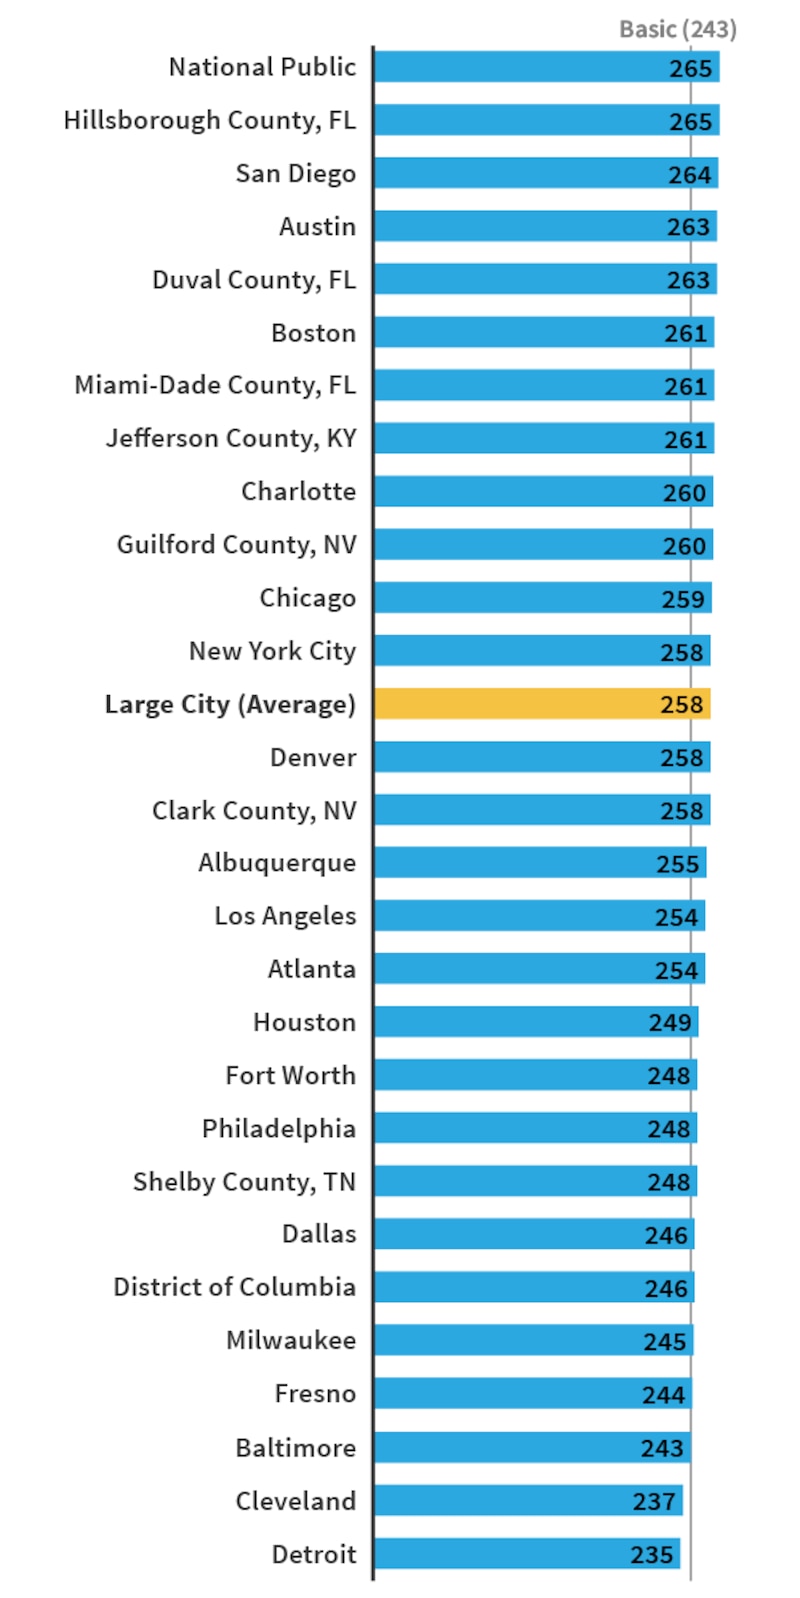
The Memphis district ranked close to the lowest third in fourth-grade math and reading and in the lowest third in eighth-grade math and reading compared to other cities.
In addition, the scores from Shelby County Schools lagged far behind Tennessee’s scores. Candice McQueen, Tennessee’s top education official, said given Shelby County Schools’ recent performance on the state’s more rigorous test last year, the national city comparison was not surprising.
Superintendent Dorsey Hopson said the results tell him the district needs to stay the course in implementing a myriad of changes to better match instruction to state and national benchmarks.
“I think we’re doing the right work. I think it’s going to take time to implement all the things we want to implement,” he said Tuesday. “To me, it validates why you have to change. Expose kids and prepare kids for the rigor that NAEP measures as well as what the new Tennessee test requires.”
Hopson had said his district was driving the state’s gains over the past several years. He based his claims on the improvements students made on state tests that prior year. It’s still possible that Memphis students propelled the state’s outsized gains on NAEP between 2011 and 2015 — but the new data suggest that local students’ skills are hardly worth bragging about. Shelby County Schools, Tennessee’s largest district, makes up 11 percent of the state’s student population.
When the state introduced a new test in 2017, Shelby County’s performance dropped, along with the state’s. “Shelby County was in some of our lowest proficiency levels across the board, as many of our urban districts,” McQueen said. “So we need to continue to think about what are we doing specifically across all of our urban districts to provide support, resources, and intention to all students.”
The national test is low stakes for individual students and schools, but high stakes for politicians and education leaders who use the scores to tout or denounce education policies. The federal agency that administers the tests warns against connecting scores to specific policies.
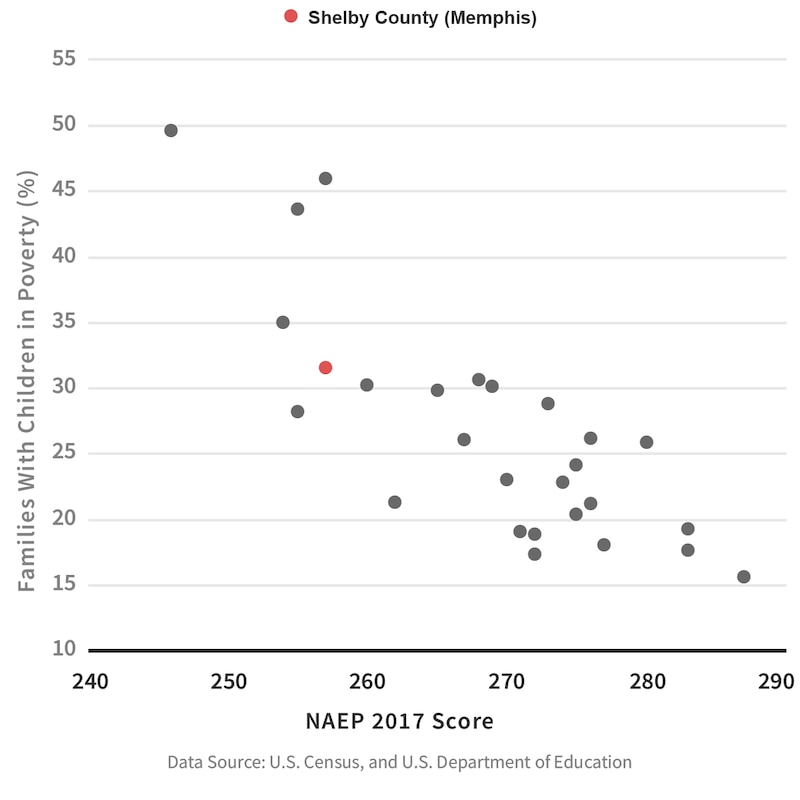
A Shelby County Schools statement notes that Memphis fourth graders “surpassed their peers in cities like ours” in which 30 percent or more school-age children live in poverty.
“And with the exception of Atlanta, the cities our students are lagging behind have less than 30-percent of their school-aged children living in poverty, which makes the correlation clear.”
Of the participating school districts, Memphis’ 30 percent poverty rate for children was the fifth highest of the participating urban school districts, according to U.S. Census data. Their test scores mostly correlated with the percentage of families with children living in poverty, with the exception of eighth-grade reading, in which Memphis students scored higher than their poverty ranking.
Note: The score threshold for “basic” in the charts below signifies partial mastery according to NAEP’s standards.
Update, April 10, 2018: This story has been updated to include a statement from Shelby County Schools, comment from Dorsey Hopson, and more information about city NAEP scores and their poverty rates.
We created several graphs and charts to examine NAEP scores in Memphis, Tennessee and across cities. Look through them all or skip to the ones you’re most interested in:
— 2017 NAEP Trial Urban District Assessment Rankings for 4th Grade Math
— 2017 NAEP Trial Urban District Assessment Rankings for 8th Grade Math
— 2017 NAEP Trial Urban District Assessment Rankings for 4th Grade Reading
— 2017 NAEP Trial Urban District Assessment Rankings for 8th Grade Reading
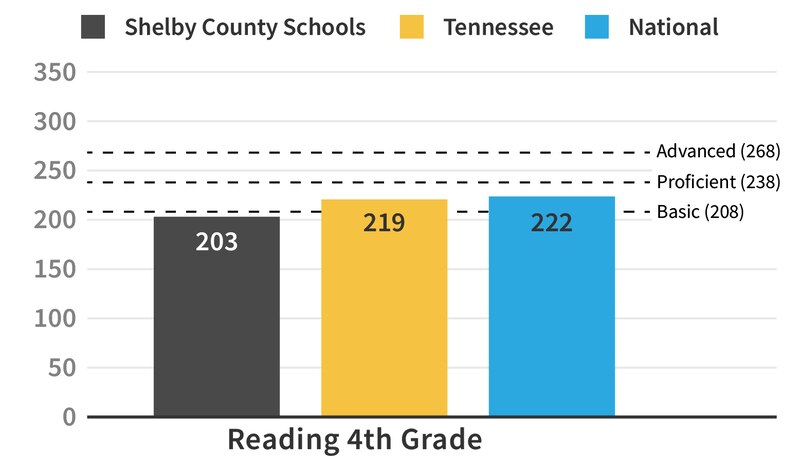
— Comparing Memphis, Tennessee and nation: 4th grade reading
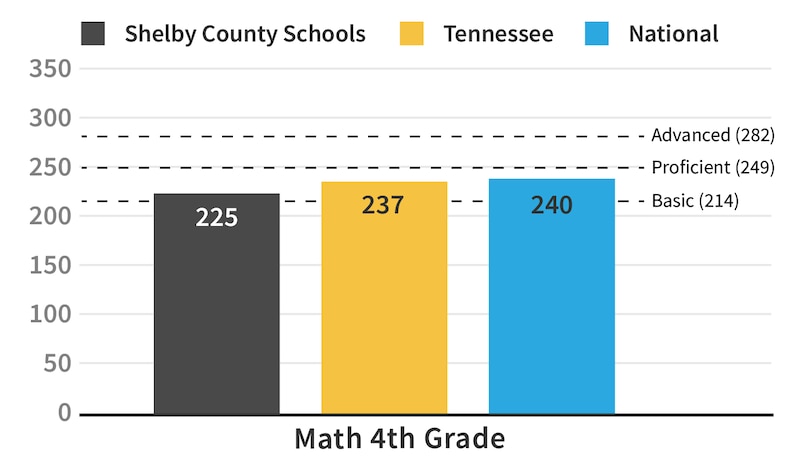
— Comparing Memphis, Tennessee and nation: 4th grade math
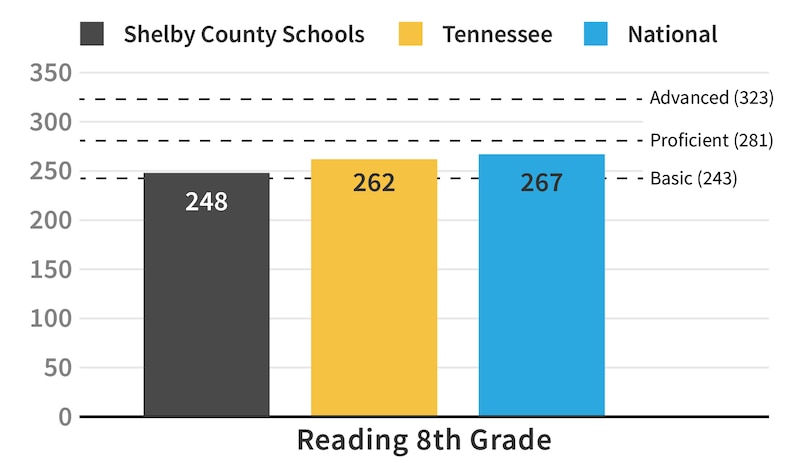
— Comparing Memphis, Tennessee and nation: 8th grade reading
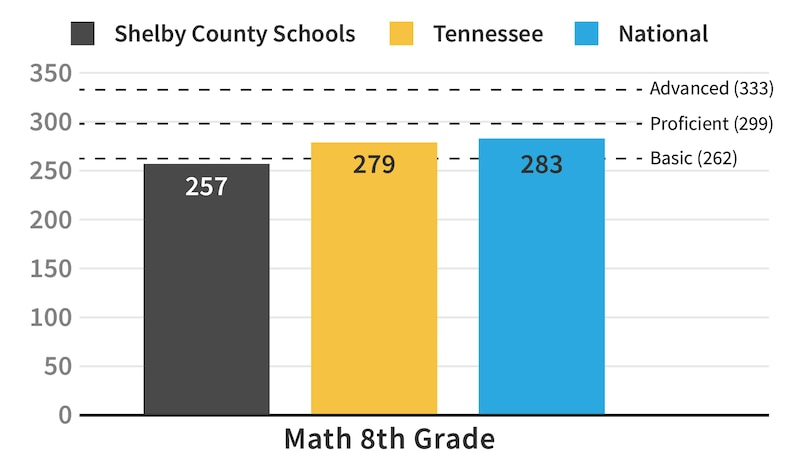
— Comparing Memphis, Tennessee and nation: 8th grade math
— Large City NAEP scores by Poverty: 4th grade reading
— Large City NAEP scores by Poverty: 4th grade math
— Large City NAEP scores by Poverty: 8th grade reading
— Large City NAEP scores by Poverty: 8th grade math
2017 NAEP Trial Urban District Assessment Rankings for 4th Grade Math
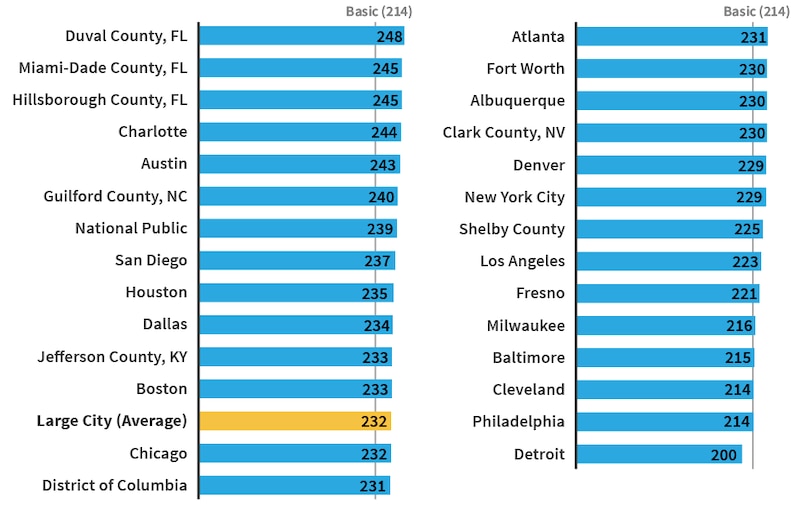
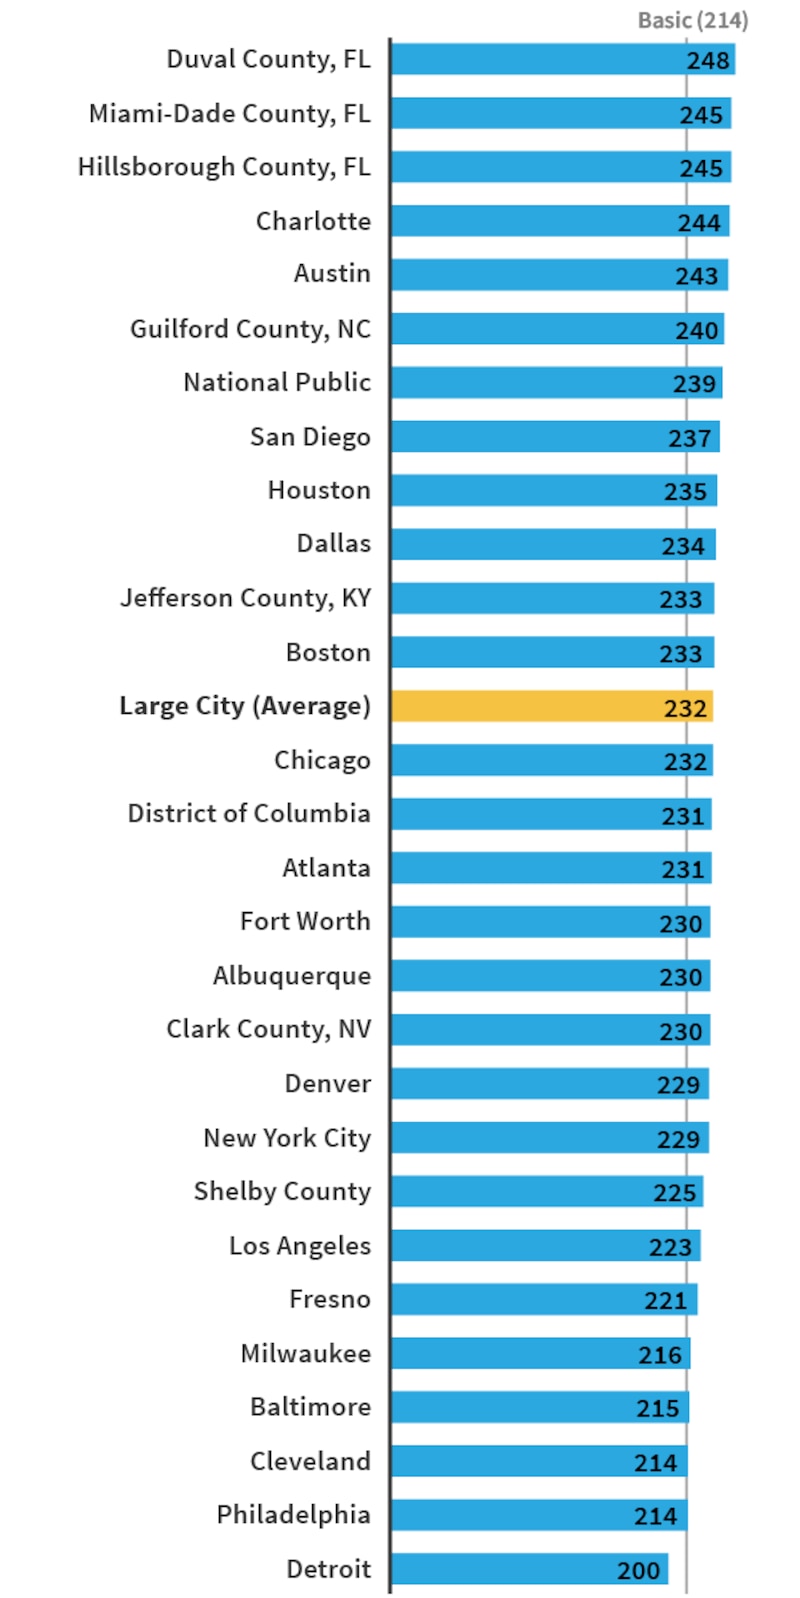
2017 NAEP Trial Urban District Assessment Rankings for 8th Grade Math
2017 NAEP Trial Urban District Assessment Rankings for 4th Grade Reading
2017 NAEP Trial Urban District Assessment Rankings for 8th Grade Reading
Comparing Memphis, Tennessee and nation: 4th grade reading
Comparing Memphis, Tennessee and nation: 4th grade math
Comparing Memphis, Tennessee and nation: 8th grade reading
Comparing Memphis, Tennessee and nation: 8th grade math
Large City NAEP scores by Poverty: 4th grade reading

Large City NAEP scores by Poverty: 4th grade math
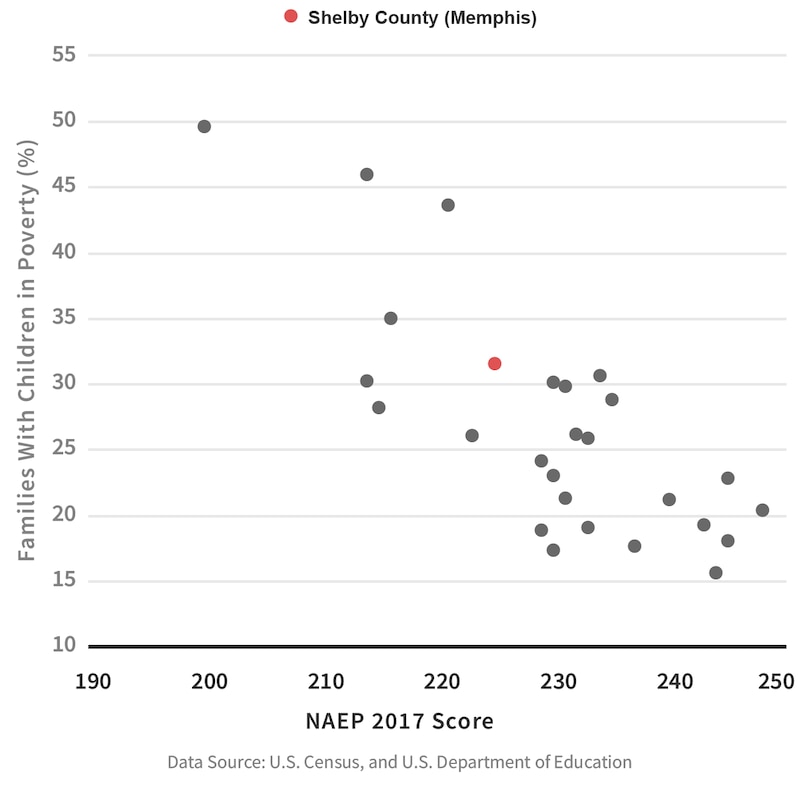
Large City NAEP scores by Poverty: 8th grade reading
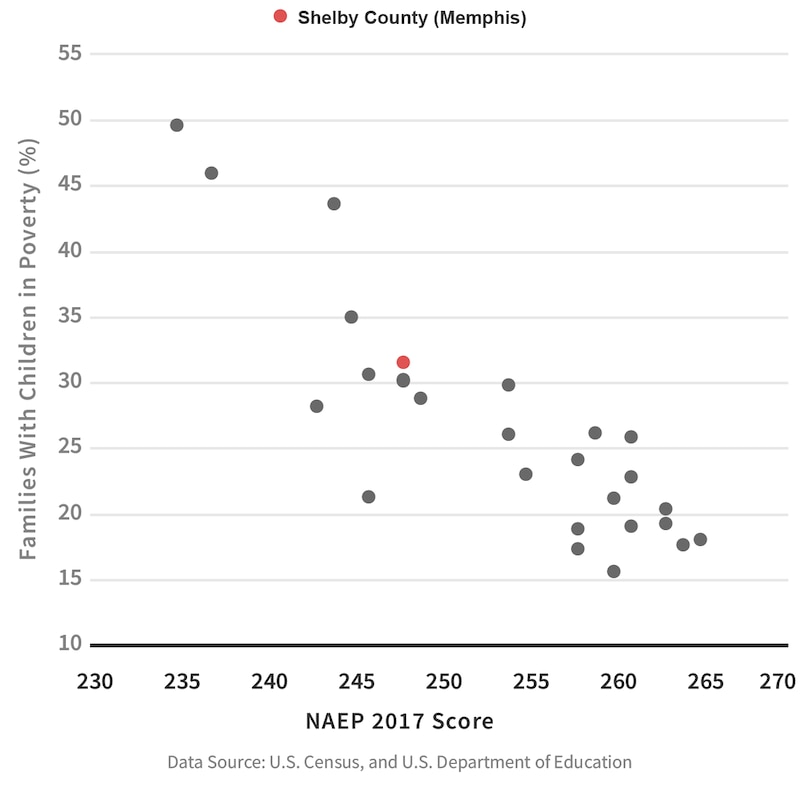
Large City NAEP scores by Poverty: 8th grade math