Most schools in Shelby County Schools showed progress in all subjects except science, but students still outshined their peers across the state in science, earning them the state’s highest rating in growth.
About half of schools in the Memphis district saw a bump in English scores, also earning the district the highest rating of growth under the Tennessee Value-Added Assessment System, known as TVAAS.
Superintendent Dorsey Hopson attributed the gains to a renewed focus in preschool education in recent years, adding a reading curriculum more aligned with state standards, and doubling down on literacy training for teachers and students.
“When you think about the investments that we’ve been able to make in schools over the last two years, I think the data is showing that we’re seeing a good return on our investment,” he told reporters Thursday.
But the scores don’t come without tension. Hopson recently teamed up with Shawn Joseph, the director of Metro Nashville Public Schools, to declare “no confidence” in the state’s test delivery system, which has been plagued with online problems since it began in 2016. Still, Hopson said educators are utilizing the data available to adjust strategies.
“It’s an imperfect measure, but it’s the measure we have right now,” he said. Hopson worries the failures of the state’s online testing system used by high schoolers made “some teachers and students lose focus.”
“There’s impact on those kids that we may never know about,” he said.
Find your school and compare here
The state doesn’t release data for an exam if fewer than 5 percent of students performed on grade level or if 95 percent of students were above grade level. An asterisk signifies that a school’s score falls in one of those two categories.
Editor’s note: The tool to look up school test scores has been updated to clarify scores per grade level. For elementary and middle schools, the scores indicate the percent of students in grades 3-8 who performed at grade level. For high schools, the scores indicate the percent of students in grades 9-12 who performed at grade level. If a school has students in both categories, we’ve listed how students performed both in grades up to 8th grade and high school levels.
District-wide results released in July show that more young students are reading on grade-level, and that math scores went up across the board. But the percentage of high school students who scored proficient in reading dropped by 4 percentage points. Shelby County Schools still lags significantly behind the state average.
Shelby County Schools also improved its overall growth score, which measures how students performed compared to peers across the state who scored similarly to them the year before. It increased from 1 to 2 on a scale of 5. More than half of schools scored 3 or above, meaning those students scored on par or more than their peers.
The district’s nearly 200 schools include about 50 charter schools that are managed by nonprofit organizations but receive public funding. The rest are run by the district.
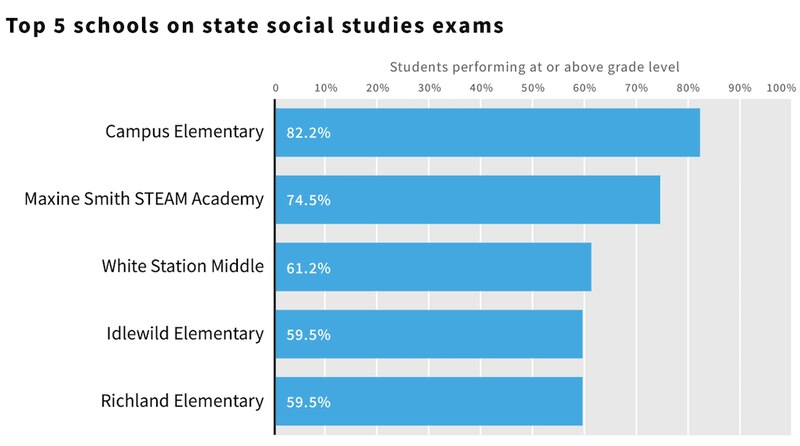
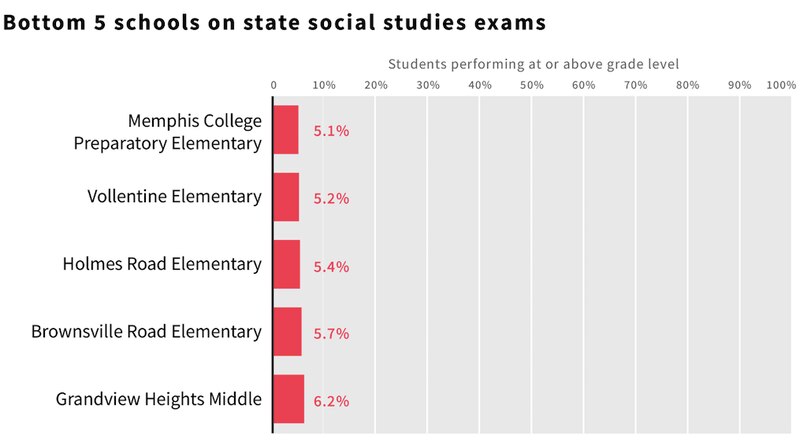
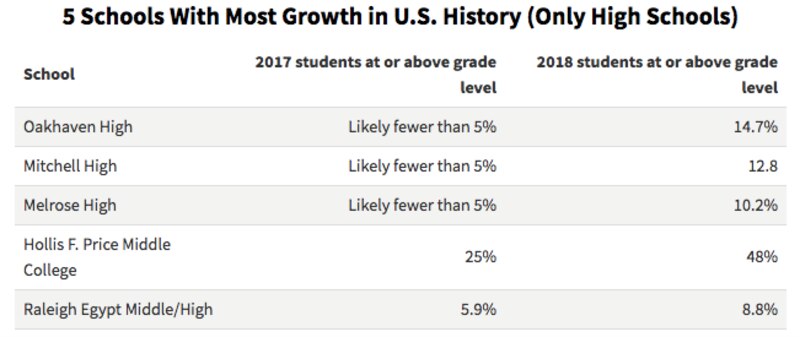
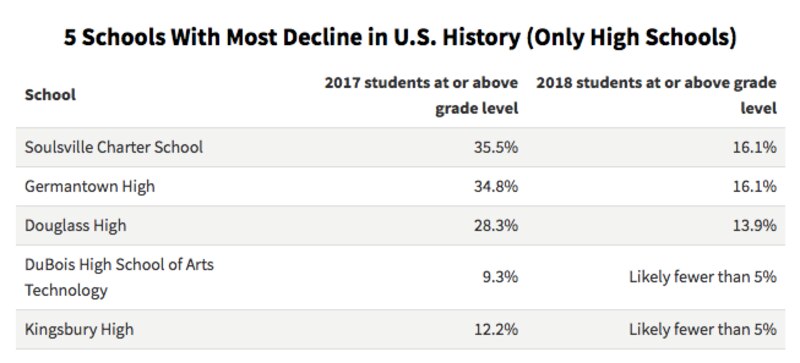
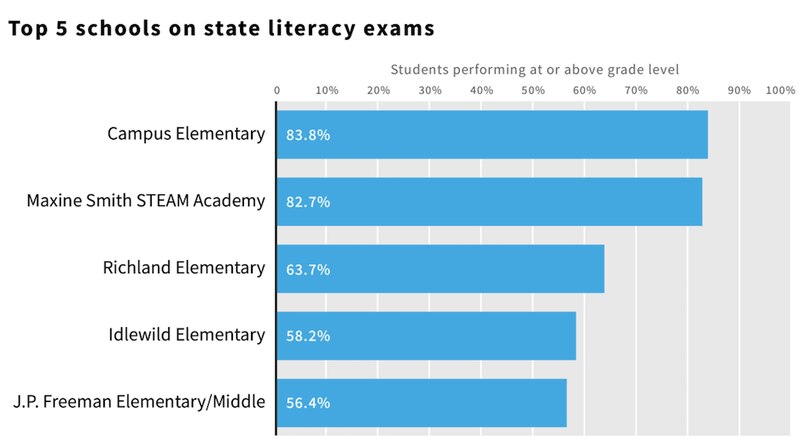
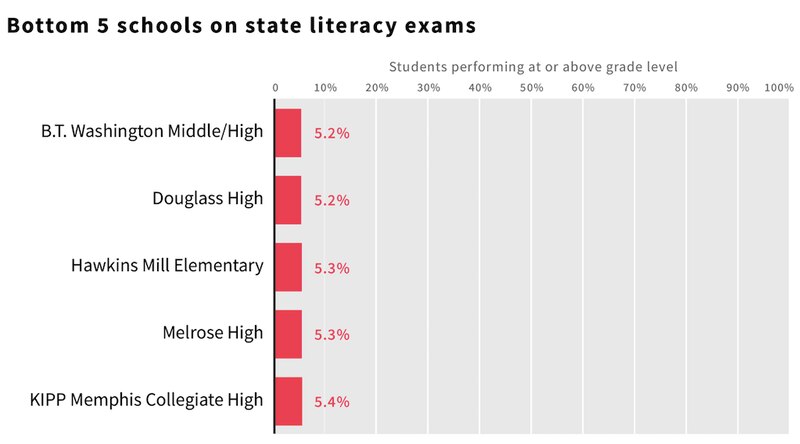
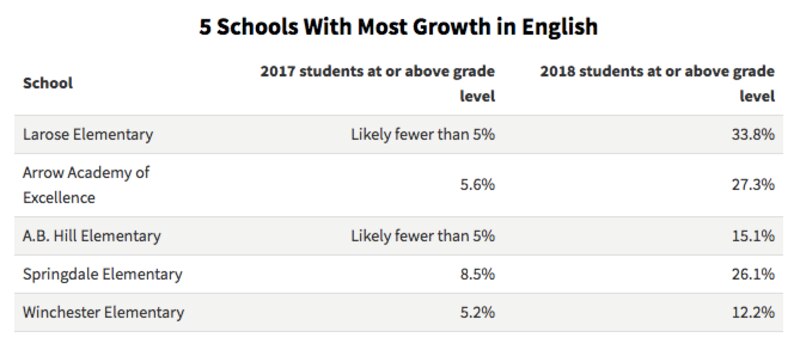
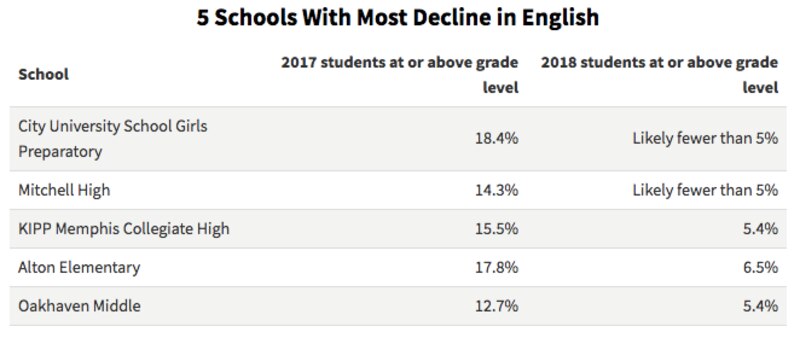
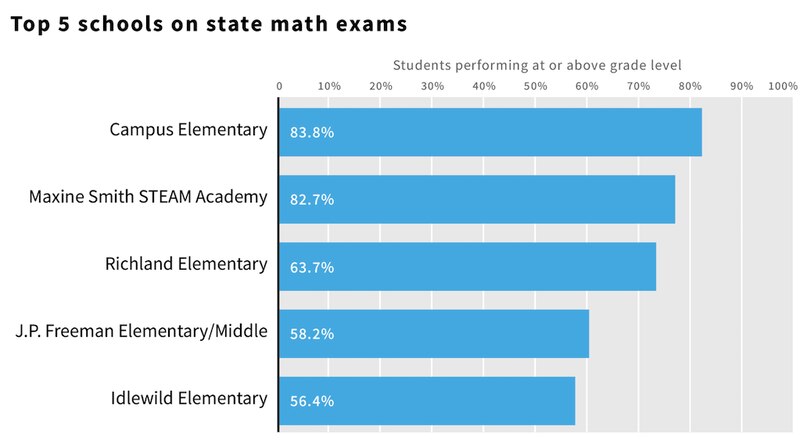
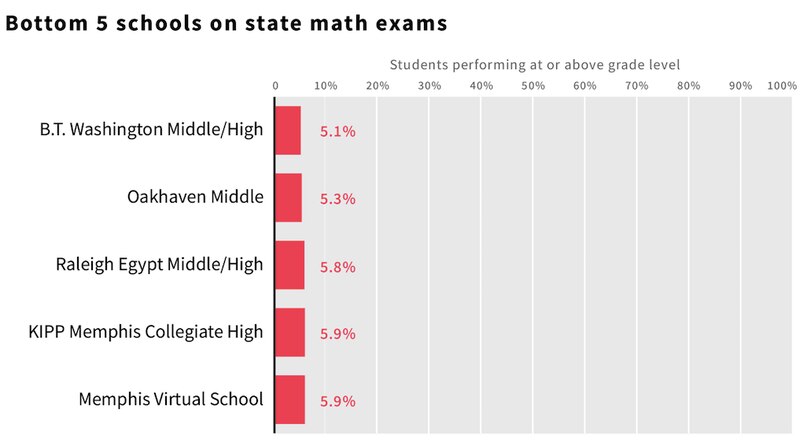
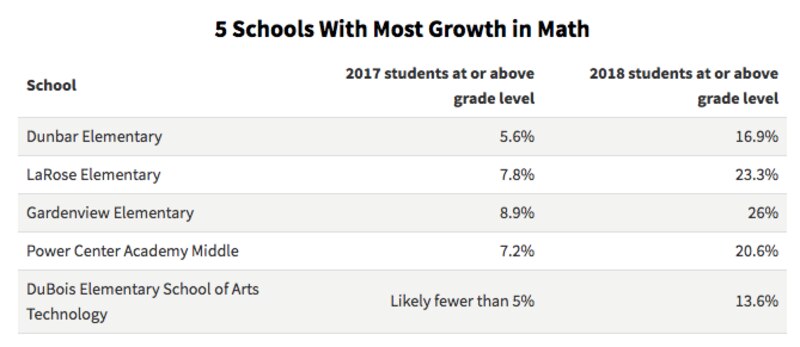
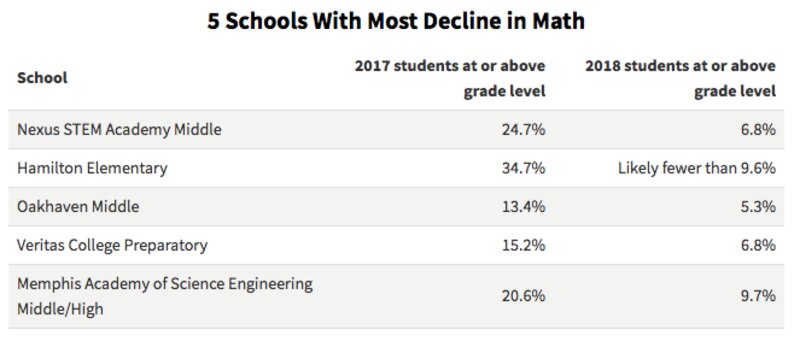
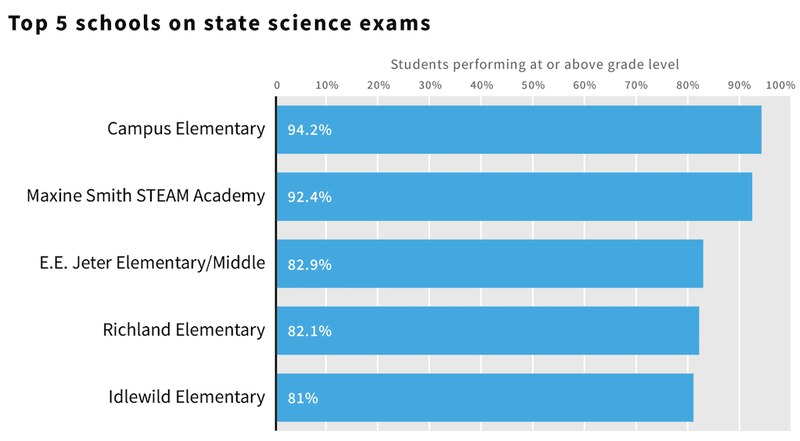
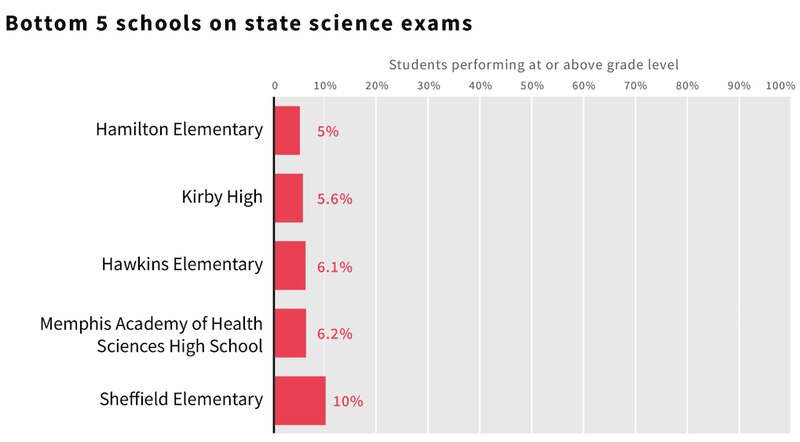
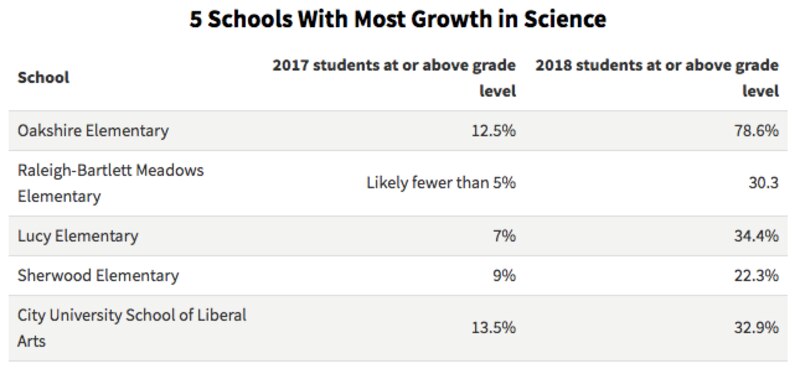
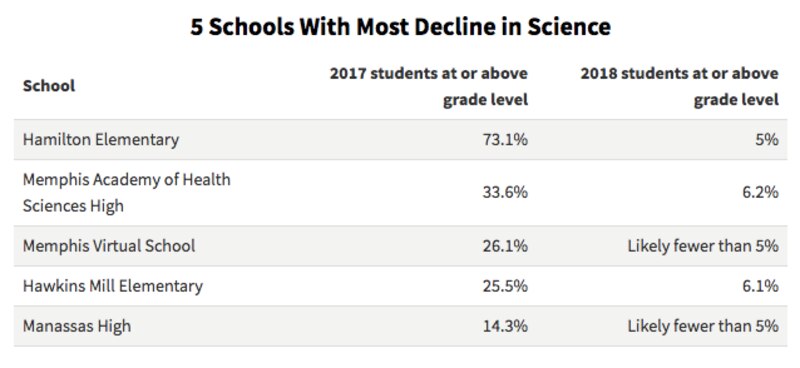
Below are charts showing the five schools that performed best and worst in the district in each subject, as well as those that grew or declined the most in each subject.
The state doesn’t release data for an exam if fewer than 5 percent of students were on grade level or if 95 percent of students were above grade level. The charts below only include schools that fall in between that range.
English Language Arts
Math
Science
Social Studies