


Scores on the exams known as the “nation’s report card” have barely budged over the last two years, new data show.
The minimal progress on the federal math and reading exams given to fourth and eighth graders will be a disappointment to officials who have hoped that their policies would boost students’ performance or help close yawning gaps between groups of students.
The 2017 results also mean that the U.S. has seen its test scores largely stagnate for a decade, after 10 years of substantial gains in math. The country’s “achievement gaps” between black and white students, and between low-income and affluent students, have also largely held steady over the last 10 years.
“I’m pleased that eighth-grade reading scores improved slightly but remain disappointed that only about one-third of America’s fourth- and eighth-grade students read at the NAEP Proficient level,” said former Michigan Governor John Engler, the chair of the National Assessment Governing Board, which oversees the tests. “We are seeing troubling gaps between the highest- and lowest-performing students. We must do better for all children.”
In an era when standardized testing is commonplace, the National Assessment of Educational Progress is the rare exam with low stakes for individual students and schools, but high stakes for politicians and policymakers. Some education leaders have staked their own reputations on NAEP results.
But score analyzers, beware: It’s difficult to draw conclusions about the benefits of specific policies based on the results. NCES, the federal agency that administers the tests, warns against it.
Some have also questioned what the transition to digital assessments means for the trends in individual state results, though NCES insists that extensive efforts have been made to account for this change.
Still, advocates on all sides will use them to argue for their preferred changes to education policy. U.S. Secretary of Education Betsy DeVos has already praised the gains in one state, Florida, and highlighted the disappointing national results. “The report card is in, and the results are clear: We can and we must do better for America’s students,” she said.
What you should know about NAEP and this year’s scores
The National Assessment of Educational Progress is administered by the federal government to a sample of students across the country. The most closely watched tests are the fourth- and eighth-grade math and reading exams, since they show how scores are changing nationally, in individual states, and in a number of cities.
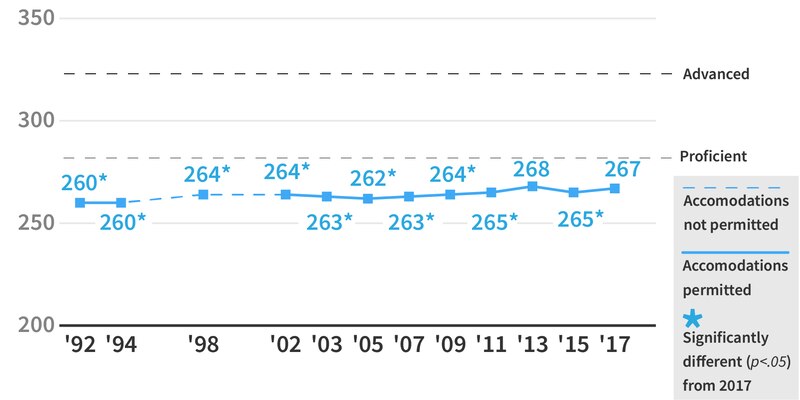
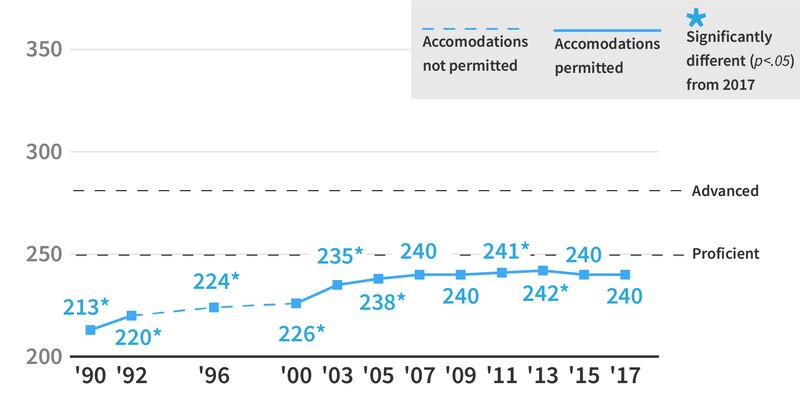
The 2017 results showed only tiny differences from 2015: a loss of 1 point in both subjects in fourth grade, and a gain of 1 point in both subjects in eighth grade. Only the grade eight reading improvement was statistically significant compared to the last test.
(One way to think about how big that is: the difference between the “basic” and the “proficiency” benchmarks is about 35 points, depending on the test.)
Most students did not reach the test’s “proficient” benchmark, which is considered a high bar to clear. But some groups of students remain further behind.
In eighth-grade math, the average black student scored just below the “basic” benchmark, while the average white student came several points shy of the higher “proficient” benchmark. Forty-four percent of white students were proficient, compared to 20 percent of Hispanic students and 13 percent of black students.
Gaps were similarly large between students who did and did not qualify for free or reduced-price lunch, a common proxy for poverty.
While test score gaps by race and poverty remained static, there was a notable increase in the difference in performance between the highest achieving students and the lowest-achieving ones.
As expected, some states and cities saw their scores rise and fall modestly, though the vast majority held steady. Alaska, Louisiana, New Hampshire, South Carolina, and Vermont saw statistically significant declines on two or more tests, while Florida was the only state that made significant gains on multiple tests. None of the state improvements or drops were more than 6 points.
Eighth grade reading scores over time
Fourth grade math scores over time
Louisiana, New Mexico, and Mississippi students continued to rank at or near the bottom, while Massachusetts, New Jersey, and New Hampshire students perform consistently well.
(Since state demographics vary — and NAEP results are highly correlated with race and poverty — research has tried to account to for that to better isolate performance of schools, and those rankings differ significantly.)
The longer-run trends in NAEP are more positive than the latest results. Nationally, scores have improved substantially in math and modestly in reading since the early 1990s.
What’s the deal with the flat scores?
It’s unclear why scores are flat. NCES, which administers the exam, says the scores could be influenced by specific policies, resources available to schools, and demographics.
That’s a frustrating limitation for policymakers who want clear solutions. It’s also unlikely to stop the finger-pointing and policy prescriptions.
Critics of the reform efforts that prevailed under the Obama administration — the expansion of charter schools, introduction of the Common Core learning standards, and the creation of new teacher evaluation systems — will likely see the results as vindication, even as supporters use the latest data to argue that public schools need substantial change.
A handful of careful statistical analyses have tried to gauge how certain policies have affected NAEP scores in the past. For instance, one recent study found that states that made greater cuts in school funding in response to the Great Recession saw worse NAEP scores as a result; an older study found that an infusion of school funding led to greater NAEP gains.
Other research has found that when states introduce stringent school accountability systems, they do better on the NAEP math tests.